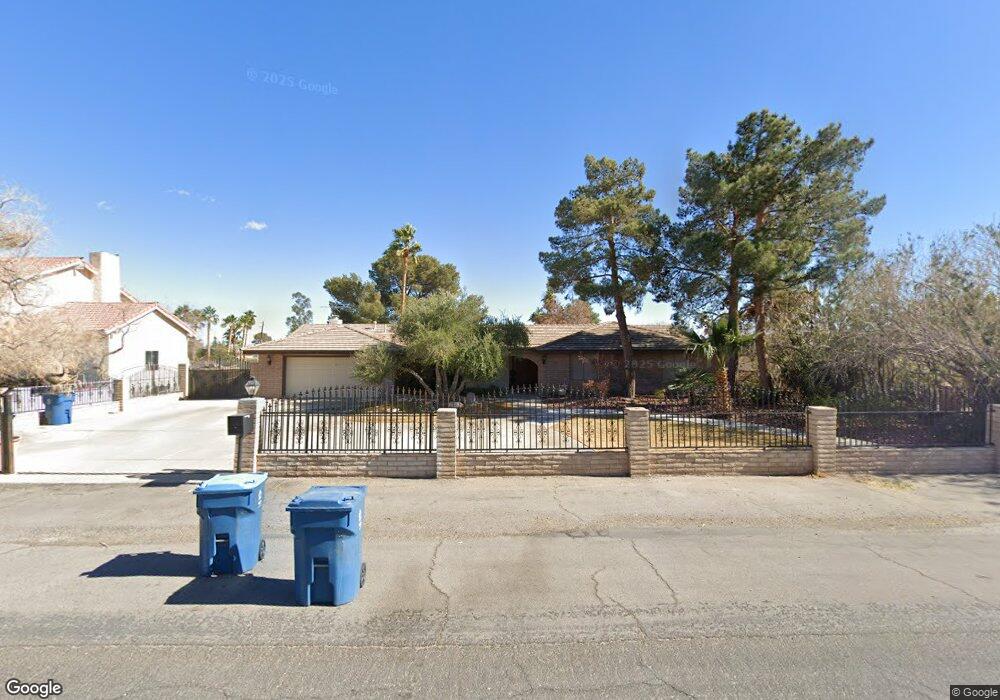
3074 Santa Margarita St Las Vegas, NV 89146
Estimated Value: $714,037 - $776,000
4
Beds
2
Baths
2,648
Sq Ft
$282/Sq Ft
Est. Value
About This Home
This home is located at 3074 Santa Margarita St, Las Vegas, NV 89146 and is currently estimated at $745,759, approximately $281 per square foot. 3074 Santa Margarita St is a home located in Clark County with nearby schools including R Guild Gray Elementary School, Kenny C Guinn Middle School, and Bonanza High School.
Ownership History
Date
Name
Owned For
Owner Type
Purchase Details
Closed on
Jul 15, 2015
Sold by
Cole Candace L and Cole Robert E
Bought by
Vu Tuan and Vu Roxanne
Current Estimated Value
Home Financials for this Owner
Home Financials are based on the most recent Mortgage that was taken out on this home.
Original Mortgage
$262,500
Outstanding Balance
$206,032
Interest Rate
4.05%
Mortgage Type
New Conventional
Estimated Equity
$539,727
Purchase Details
Closed on
Aug 27, 2010
Sold by
Estate Of Lona Holland
Bought by
Cole Candale L and Cole Ii Robert E
Home Financials for this Owner
Home Financials are based on the most recent Mortgage that was taken out on this home.
Original Mortgage
$266,412
Interest Rate
4.5%
Mortgage Type
FHA
Purchase Details
Closed on
Nov 13, 1995
Sold by
Kristensen Daniel R and Kristensen Jo Anne K
Bought by
Holland Lona
Create a Home Valuation Report for This Property
The Home Valuation Report is an in-depth analysis detailing your home's value as well as a comparison with similar homes in the area
Home Values in the Area
Average Home Value in this Area
Purchase History
| Date | Buyer | Sale Price | Title Company |
|---|---|---|---|
| Vu Tuan | $350,000 | Nevada Title Las Vegas | |
| Cole Candale L | $270,000 | Netco | |
| Holland Lona | $225,000 | Nevada Title Insurance Co |
Source: Public Records
Mortgage History
| Date | Status | Borrower | Loan Amount |
|---|---|---|---|
| Open | Vu Tuan | $262,500 | |
| Previous Owner | Cole Candale L | $266,412 |
Source: Public Records
Tax History Compared to Growth
Tax History
| Year | Tax Paid | Tax Assessment Tax Assessment Total Assessment is a certain percentage of the fair market value that is determined by local assessors to be the total taxable value of land and additions on the property. | Land | Improvement |
|---|---|---|---|---|
| 2025 | $3,379 | $130,266 | $70,000 | $60,266 |
| 2024 | $3,129 | $130,266 | $70,000 | $60,266 |
| 2023 | $2,084 | $122,263 | $63,000 | $59,263 |
| 2022 | $2,898 | $111,597 | $56,000 | $55,597 |
| 2021 | $2,683 | $104,365 | $50,400 | $53,965 |
| 2020 | $2,489 | $100,064 | $45,500 | $54,564 |
| 2019 | $2,332 | $91,543 | $36,750 | $54,793 |
| 2018 | $2,226 | $90,554 | $36,750 | $53,804 |
| 2017 | $2,707 | $92,299 | $36,750 | $55,549 |
| 2016 | $2,084 | $81,560 | $24,500 | $57,060 |
| 2015 | $2,079 | $68,643 | $21,000 | $47,643 |
| 2014 | $2,014 | $72,237 | $21,000 | $51,237 |
Source: Public Records
Map
Nearby Homes
- 6742 Palmyra Ave
- 3134 Sterlingshire Dr
- 2989 Santa Margarita St
- 3191 Redwood St
- 3188 Redwood St
- 2830 S Rainbow Blvd
- 7045 Edna Ave
- 2845 Rosanna St
- 3381 Basque St
- 3249 S Torrey Pines Dr
- 6576 Turina Rd
- 3269 S Torrey Pines Dr
- 6465 Edna Ave
- 7140 Palmyra Ave
- 2975 Montessouri St
- 6540 Tara Ave
- 3195 Mann St
- 3160 Belcastro St
- 7165 Coley Ave
- 2780 Montessouri St
- 3084 Santa Margarita St
- 3060 Santa Margarita St
- 6762 Palmyra Ave
- 3030 Santa Margarita St
- 3095 Santa Margarita St
- 3055 Santa Margarita St
- 6781 Palmyra Ave
- 6765 Palmyra Ave
- 3020 Santa Margarita St
- 3029 Santa Margarita St
- 6755 Coley Ave
- 6751 Palmyra Ave
- 6780 Irish Sea Ave
- 6745 Coley Ave
- 6770 Irish Sea Ave
- 3075 Redwood St
- 3019 Santa Margarita St
- 3010 Santa Margarita St
- 6840 Palmyra Ave
- 3065 Redwood St