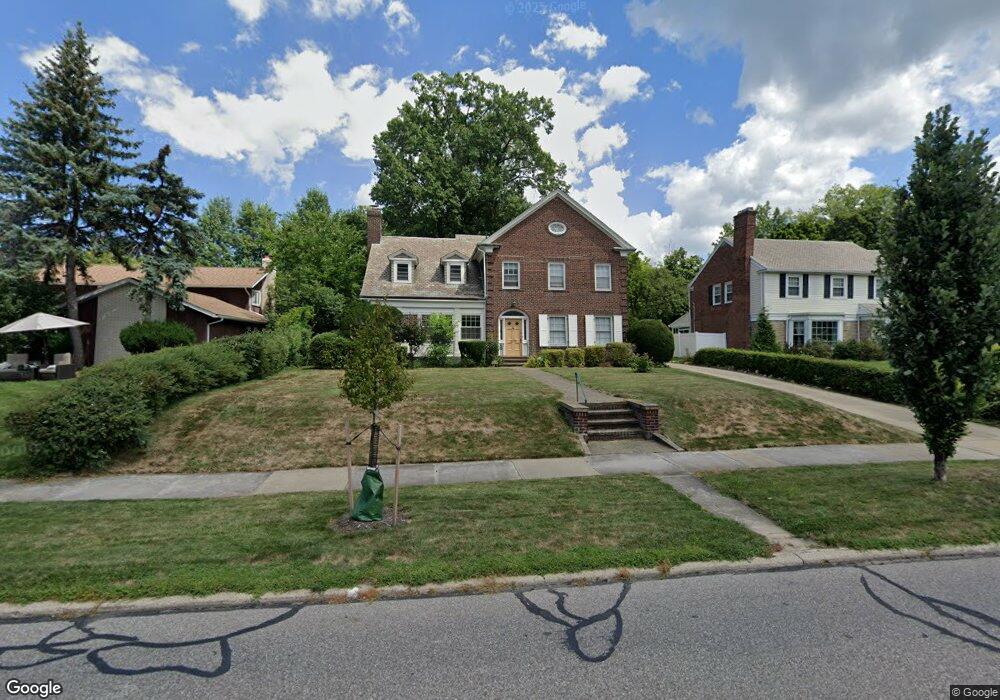
3079 Van Aken Blvd Cleveland, OH 44120
Estimated Value: $404,000 - $518,000
3
Beds
3
Baths
3,271
Sq Ft
$148/Sq Ft
Est. Value
About This Home
This home is located at 3079 Van Aken Blvd, Cleveland, OH 44120 and is currently estimated at $484,609, approximately $148 per square foot. 3079 Van Aken Blvd is a home located in Cuyahoga County with nearby schools including Onaway Elementary School, Woodbury Elementary School, and Shaker Heights Middle School.
Ownership History
Date
Name
Owned For
Owner Type
Purchase Details
Closed on
Dec 12, 2014
Sold by
Whatley Dietrix L and Whatley Jacqueline H
Bought by
Whatley Dietrix L and Whatley Jacqueline H
Current Estimated Value
Purchase Details
Closed on
Jul 28, 2004
Sold by
Vidrine J Philip and Vidrine Carla B
Bought by
Whatley Jacqueline
Home Financials for this Owner
Home Financials are based on the most recent Mortgage that was taken out on this home.
Original Mortgage
$260,000
Interest Rate
6.4%
Mortgage Type
Unknown
Purchase Details
Closed on
Dec 29, 1986
Sold by
Haller Donald B and Haller Susan Z
Bought by
Vidrine J Philip
Purchase Details
Closed on
Jun 7, 1982
Sold by
Picker Sidney I and Picker Jane M
Bought by
Haller Donald B and Haller Susan Z
Purchase Details
Closed on
Jan 1, 1975
Bought by
Picker Sidney I and Picker Jane M
Create a Home Valuation Report for This Property
The Home Valuation Report is an in-depth analysis detailing your home's value as well as a comparison with similar homes in the area
Home Values in the Area
Average Home Value in this Area
Purchase History
| Date | Buyer | Sale Price | Title Company |
|---|---|---|---|
| Whatley Dietrix L | -- | Attorney | |
| Whatley Jacqueline | $325,000 | Midland Title Agency | |
| Vidrine J Philip | $141,500 | -- | |
| Haller Donald B | $118,000 | -- | |
| Picker Sidney I | -- | -- |
Source: Public Records
Mortgage History
| Date | Status | Borrower | Loan Amount |
|---|---|---|---|
| Previous Owner | Whatley Jacqueline | $260,000 | |
| Closed | Whatley Jacqueline | $32,500 |
Source: Public Records
Tax History Compared to Growth
Tax History
| Year | Tax Paid | Tax Assessment Tax Assessment Total Assessment is a certain percentage of the fair market value that is determined by local assessors to be the total taxable value of land and additions on the property. | Land | Improvement |
|---|---|---|---|---|
| 2024 | $13,083 | $146,440 | $28,280 | $118,160 |
| 2023 | $13,194 | $117,150 | $20,200 | $96,950 |
| 2022 | $12,818 | $117,150 | $20,200 | $96,950 |
| 2021 | $12,774 | $117,150 | $20,200 | $96,950 |
| 2020 | $12,692 | $109,480 | $18,870 | $90,620 |
| 2019 | $12,509 | $312,800 | $53,900 | $258,900 |
| 2018 | $12,280 | $109,480 | $18,870 | $90,620 |
| 2017 | $12,495 | $103,430 | $15,750 | $87,680 |
| 2016 | $11,995 | $103,430 | $15,750 | $87,680 |
| 2015 | $11,442 | $103,430 | $15,750 | $87,680 |
| 2014 | $11,442 | $94,020 | $14,320 | $79,700 |
Source: Public Records
Map
Nearby Homes
- 3027 Warrington Rd
- 3155 Ludlow Rd
- 14605 S Woodland Rd
- 3133 Albion Rd
- 2917 Warrington Rd
- 0 Van Aken Blvd Unit 5021037
- 3060 Keswick Rd
- 14429 Onaway Rd
- 3127 Becket Rd
- 3077 Huntington Rd
- 3092 Becket Rd
- 3180 Chadbourne Rd
- 14506 Milverton Rd
- 14702 Milverton Rd
- 3024 Becket Rd
- 3063 Ashwood Rd
- 3261 E 147th St
- 3267 E 142nd St
- 3264 E 149th St
- 3264 E 142nd St
- 3073 Van Aken Blvd
- 3083 Van Aken Blvd
- 3085 Van Aken Blvd
- 3069 Van Aken Blvd
- 3042 Chadbourne Rd
- 3048 Chadbourne Rd
- 3038 Chadbourne Rd
- 3052 Chadbourne Rd
- 3087 Van Aken Blvd
- 3034 Chadbourne Rd
- 3063 Van Aken Blvd
- 3056 Chadbourne Rd
- 3028 Chadbourne Rd
- 3060 Chadbourne Rd
- 3057 Van Aken Blvd
- 3024 Chadbourne Rd
- 3078 Van Aken Blvd
- 3070 Chadbourne Rd
- 3068 Van Aken Blvd
- 3020 Chadbourne Rd