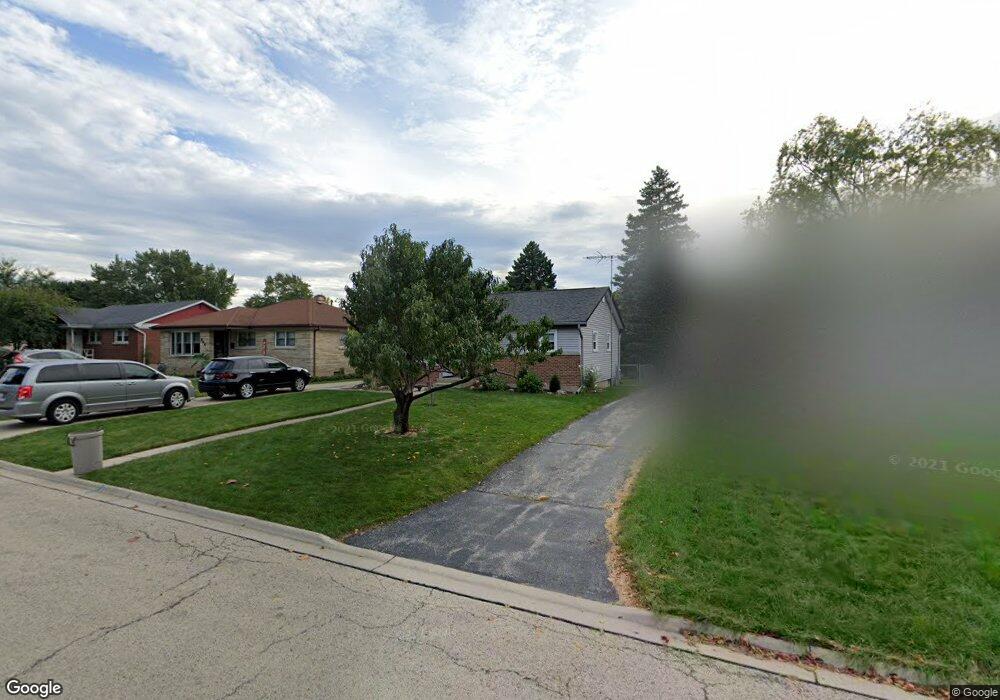
308 James Ave Mundelein, IL 60060
Estimated Value: $346,000 - $385,000
--
Bed
3
Baths
1,587
Sq Ft
$227/Sq Ft
Est. Value
About This Home
This home is located at 308 James Ave, Mundelein, IL 60060 and is currently estimated at $360,518, approximately $227 per square foot. 308 James Ave is a home located in Lake County with nearby schools including Washington Early Learning Center, Mechanics Grove Elementary School, and Carl Sandburg Middle School.
Ownership History
Date
Name
Owned For
Owner Type
Purchase Details
Closed on
Feb 23, 2023
Sold by
Casanova Jill M
Bought by
Jill M Casanova Living Trust
Current Estimated Value
Purchase Details
Closed on
Dec 30, 2002
Sold by
Casanova Jeffrey and Nelson Jill
Bought by
Casanova Jeffrey M and Casanova Jill M
Home Financials for this Owner
Home Financials are based on the most recent Mortgage that was taken out on this home.
Original Mortgage
$153,000
Interest Rate
5.71%
Purchase Details
Closed on
Aug 17, 2001
Sold by
Wyman Kenneth E and Wyman Judith M
Bought by
Casanova Jeffrey and Nelson Jill
Home Financials for this Owner
Home Financials are based on the most recent Mortgage that was taken out on this home.
Original Mortgage
$152,150
Interest Rate
7.03%
Create a Home Valuation Report for This Property
The Home Valuation Report is an in-depth analysis detailing your home's value as well as a comparison with similar homes in the area
Home Values in the Area
Average Home Value in this Area
Purchase History
| Date | Buyer | Sale Price | Title Company |
|---|---|---|---|
| Jill M Casanova Living Trust | -- | -- | |
| Casanova Jeffrey M | -- | World Title Guaranty Inc | |
| Casanova Jeffrey | $179,000 | Chicago Title Insurance Co |
Source: Public Records
Mortgage History
| Date | Status | Borrower | Loan Amount |
|---|---|---|---|
| Previous Owner | Casanova Jeffrey M | $153,000 | |
| Previous Owner | Casanova Jeffrey | $152,150 |
Source: Public Records
Tax History Compared to Growth
Tax History
| Year | Tax Paid | Tax Assessment Tax Assessment Total Assessment is a certain percentage of the fair market value that is determined by local assessors to be the total taxable value of land and additions on the property. | Land | Improvement |
|---|---|---|---|---|
| 2024 | $9,153 | $103,090 | $18,741 | $84,349 |
| 2023 | $9,153 | $95,084 | $17,286 | $77,798 |
| 2022 | $7,907 | $80,284 | $16,614 | $63,670 |
| 2021 | $7,674 | $78,555 | $16,256 | $62,299 |
| 2020 | $7,238 | $73,557 | $15,222 | $58,335 |
| 2019 | $7,184 | $72,857 | $15,077 | $57,780 |
| 2018 | $5,890 | $60,821 | $15,235 | $45,586 |
| 2017 | $5,811 | $58,901 | $14,754 | $44,147 |
| 2016 | $5,638 | $55,846 | $13,989 | $41,857 |
| 2015 | $5,463 | $52,197 | $13,075 | $39,122 |
| 2014 | $6,221 | $51,497 | $12,900 | $38,597 |
| 2012 | $5,712 | $60,111 | $14,787 | $45,324 |
Source: Public Records
Map
Nearby Homes
- 328 Brice Ave
- 841 Wilcox St
- 422 James Ave
- 215 Brice Ave
- 847 Mckinley Ave
- 659 E Maple Ave
- 701 Thomas Ct
- 49 N Shaddle Ave
- 331 Plaza Cir
- 31 Washington Blvd Unit 108
- 510 S Hickory St
- 29746 U S 45
- 40 S Seymour Ave
- 433 E High St
- 1255 Huntington Dr
- 288 N Lincoln Ave
- 137 Racine Place
- 742 N Lake St
- 422 Shadow Creek Dr
- 640 Allanson Rd