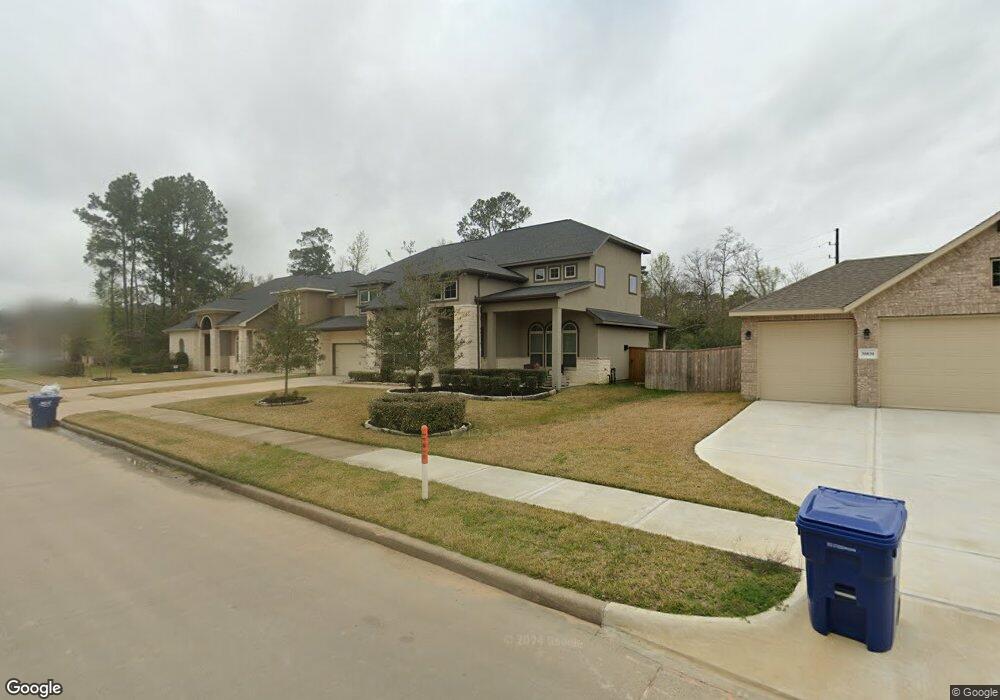
30827 Raleigh Creek Dr Tomball, TX 77375
Hufsmith NeighborhoodEstimated Value: $485,000 - $556,000
3
Beds
4
Baths
3,270
Sq Ft
$158/Sq Ft
Est. Value
About This Home
This home is located at 30827 Raleigh Creek Dr, Tomball, TX 77375 and is currently estimated at $516,131, approximately $157 per square foot. 30827 Raleigh Creek Dr is a home located in Harris County with nearby schools including Tomball Elementary School, Tomball Intermediate School, and Tomball Junior High School.
Ownership History
Date
Name
Owned For
Owner Type
Purchase Details
Closed on
Feb 26, 2021
Sold by
Lowe Brent D and Lowe Mary M
Bought by
Harris Matthew W and Harris Leigh A
Current Estimated Value
Home Financials for this Owner
Home Financials are based on the most recent Mortgage that was taken out on this home.
Original Mortgage
$310,320
Outstanding Balance
$278,180
Interest Rate
2.7%
Mortgage Type
New Conventional
Estimated Equity
$237,951
Purchase Details
Closed on
Apr 17, 2017
Sold by
Legend Classic Homes Ltd
Bought by
Lowe Brent D and Lowe Mary M
Home Financials for this Owner
Home Financials are based on the most recent Mortgage that was taken out on this home.
Original Mortgage
$308,800
Interest Rate
4.21%
Mortgage Type
New Conventional
Create a Home Valuation Report for This Property
The Home Valuation Report is an in-depth analysis detailing your home's value as well as a comparison with similar homes in the area
Home Values in the Area
Average Home Value in this Area
Purchase History
| Date | Buyer | Sale Price | Title Company |
|---|---|---|---|
| Harris Matthew W | -- | None Listed On Document | |
| Harris Matthew W | -- | None Listed On Document | |
| Lowe Brent D | -- | Lch Title Co |
Source: Public Records
Mortgage History
| Date | Status | Borrower | Loan Amount |
|---|---|---|---|
| Open | Harris Matthew W | $310,320 | |
| Closed | Harris Matthew W | $310,320 | |
| Previous Owner | Lowe Brent D | $308,800 |
Source: Public Records
Tax History Compared to Growth
Tax History
| Year | Tax Paid | Tax Assessment Tax Assessment Total Assessment is a certain percentage of the fair market value that is determined by local assessors to be the total taxable value of land and additions on the property. | Land | Improvement |
|---|---|---|---|---|
| 2025 | $12,176 | $510,869 | $79,226 | $431,643 |
| 2024 | $12,176 | $494,026 | $79,226 | $414,800 |
| 2023 | $12,176 | $515,300 | $79,226 | $436,074 |
| 2022 | $8,744 | $387,900 | $68,663 | $319,237 |
| 2021 | $8,443 | $356,000 | $52,818 | $303,182 |
| 2020 | $8,331 | $339,655 | $52,818 | $286,837 |
| 2019 | $8,386 | $332,444 | $52,818 | $279,626 |
| 2018 | $4,428 | $355,470 | $52,818 | $302,652 |
| 2017 | $9,585 | $380,356 | $52,818 | $327,538 |
| 2016 | $7,695 | $305,381 | $68,663 | $236,718 |
| 2015 | $180 | $147,799 | $52,818 | $94,981 |
| 2014 | $180 | $0 | $0 | $0 |
Source: Public Records
Map
Nearby Homes
- 12510 Sherborne Castle Ct
- 12614 Fort Isabella Dr
- 12122 Zion Rd
- 31211 Raleigh Creek Dr
- 31106 Gullwing Manor Dr
- 31134 Gullwing Manor Dr
- 31218 Gullwing Manor Dr
- 12806 Durham Creek Ln
- 25010 Butler Hill Ct
- 25003 Tarlton Ct
- 24801 Stanolind Rd
- 12118 S Tara Plantation Dr
- 25142 W Tara Plantation Dr
- 1323 E Hufsmith Rd
- 11827 Tara Plantation Dr
- 25202 Wilkes Park Rd
- 24102 Flax Ct
- 25203 Elijah Ct
- 25211 Melanie Pointe
- 13303 Lost Creek Rd
- 30827 Raleigh Creek Dr
- 30823 Raleigh Creek Dr
- 30823 Raleigh Creek Dr
- 30819 Raleigh Creek Dr
- 30803 Berkshire Downs Dr
- 30826 Raleigh Creek Dr
- 30822 Raleigh Creek Dr
- 30807 Berkshire Downs Dr
- 30830 Raleigh Creek Dr
- 30815 Raleigh Creek Dr
- 30826 Raleigh Creek Dr
- 30834 Raleigh Creek Dr
- 30810 Berkshire Down Berkshire Downs Dr
- 12502 Montclair Landing Ct
- 30811 Berkshire Downs Dr
- 30818 Raleigh Creek Dr
- 30903 Raleigh Creek Dr
- 30811 Raleigh Creek
- 30811 Raleigh Creek Dr
- 30814 Raleigh Creek Dr