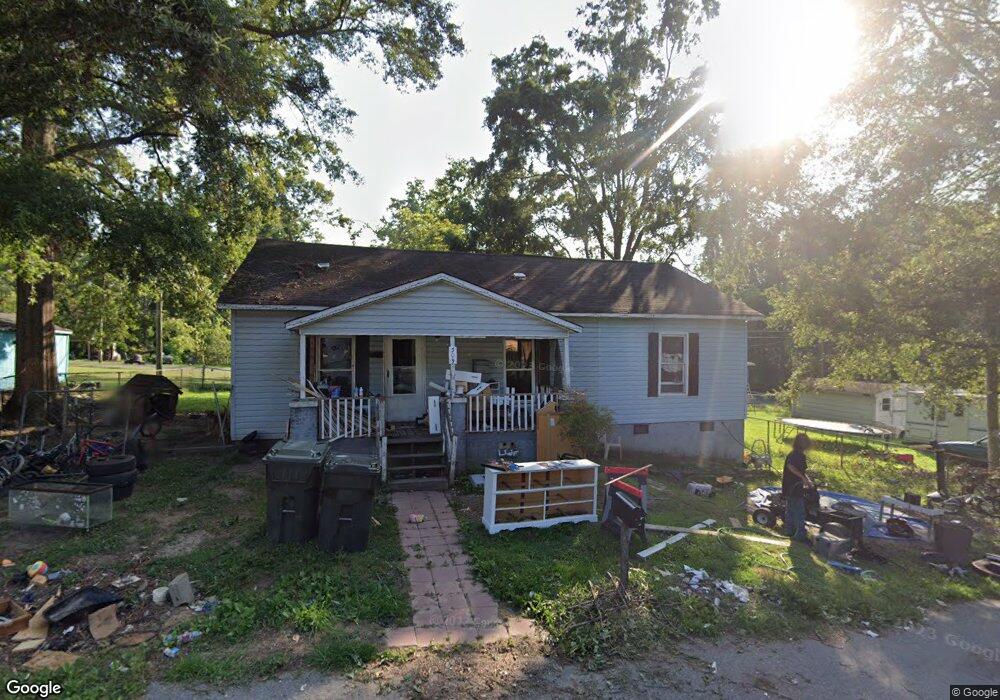
309 Black St Cherryville, NC 28021
Estimated Value: $129,623 - $230,000
2
Beds
1
Bath
1,176
Sq Ft
$160/Sq Ft
Est. Value
About This Home
This home is located at 309 Black St, Cherryville, NC 28021 and is currently estimated at $188,406, approximately $160 per square foot. 309 Black St is a home located in Gaston County with nearby schools including Cherryville Elementary School, William B. Beam Intermediate School, and John Chavis Middle School.
Ownership History
Date
Name
Owned For
Owner Type
Purchase Details
Closed on
Feb 14, 2008
Sold by
Hester Gary W and Gray Debbie H
Bought by
Hester Gary W
Current Estimated Value
Purchase Details
Closed on
Oct 2, 2007
Sold by
Hester Gary W
Bought by
Gray Debbie H
Purchase Details
Closed on
Sep 16, 2005
Sold by
Wells Fargo Bank Na
Bought by
Hester Gary W
Purchase Details
Closed on
Nov 30, 2004
Sold by
Wall Leslie H and Wall Terry L
Bought by
Wells Fargo Bank Minnesota Na and Option One Woodbridge Loan Trust 2003-2
Purchase Details
Closed on
Apr 24, 2001
Sold by
Hester Gary and Hester Judy
Bought by
Wall Terry L and Wall Leslie H
Home Financials for this Owner
Home Financials are based on the most recent Mortgage that was taken out on this home.
Original Mortgage
$38,000
Interest Rate
6.98%
Create a Home Valuation Report for This Property
The Home Valuation Report is an in-depth analysis detailing your home's value as well as a comparison with similar homes in the area
Home Values in the Area
Average Home Value in this Area
Purchase History
| Date | Buyer | Sale Price | Title Company |
|---|---|---|---|
| Hester Gary W | -- | None Available | |
| Gray Debbie H | -- | None Available | |
| Hester Gary W | $24,500 | -- | |
| Wells Fargo Bank Minnesota Na | $39,100 | -- | |
| Wall Terry L | $38,000 | -- |
Source: Public Records
Mortgage History
| Date | Status | Borrower | Loan Amount |
|---|---|---|---|
| Previous Owner | Wall Terry L | $38,000 |
Source: Public Records
Tax History Compared to Growth
Tax History
| Year | Tax Paid | Tax Assessment Tax Assessment Total Assessment is a certain percentage of the fair market value that is determined by local assessors to be the total taxable value of land and additions on the property. | Land | Improvement |
|---|---|---|---|---|
| 2025 | $681 | $63,080 | $6,000 | $57,080 |
| 2024 | $1,417 | $63,080 | $6,000 | $57,080 |
| 2023 | $688 | $63,080 | $6,000 | $57,080 |
| 2022 | $587 | $44,160 | $6,000 | $38,160 |
| 2021 | $596 | $44,160 | $6,000 | $38,160 |
| 2019 | $574 | $44,160 | $6,000 | $38,160 |
| 2018 | $535 | $40,218 | $8,400 | $31,818 |
| 2017 | $535 | $40,218 | $8,400 | $31,818 |
| 2016 | $535 | $40,218 | $0 | $0 |
| 2014 | $557 | $41,883 | $10,500 | $31,383 |
Source: Public Records
Map
Nearby Homes
- 302 N Houser St
- 400 N Houser St
- 709 E Main St
- 5.68 acres Rosewood Ln
- 111 Sussex Ave
- 613 N Pink St
- 500 N Mountain St
- 00 N Carolina 274
- 708 Requa Rd
- 704 Hawthorne St
- 413 N Mulberry St
- 404 Kings Dr
- 510 N Mulberry St
- 512 N Mulberry St
- 210 W Church St
- 514 N Mulberry St
- 600 Queens Rd
- 516 N Mulberry St
- 507 N Elm St
- 00 Requa Rd