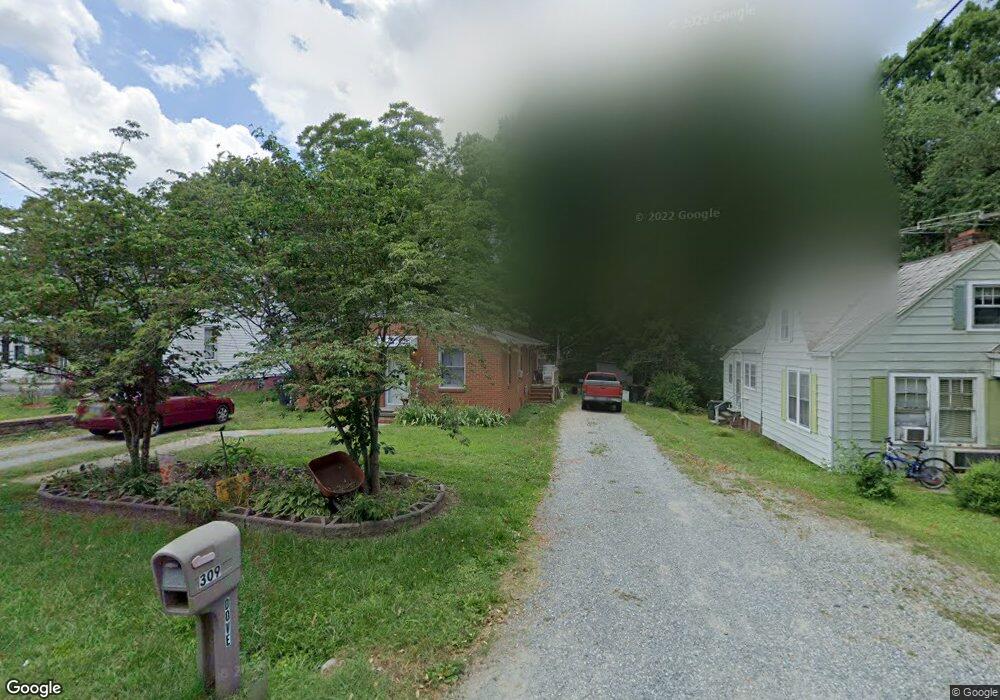
309 Georgia Ave Unit 311 Burlington, NC 27217
East Burlington NeighborhoodEstimated Value: $117,000 - $135,000
2
Beds
2
Baths
975
Sq Ft
$133/Sq Ft
Est. Value
About This Home
This home is located at 309 Georgia Ave Unit 311, Burlington, NC 27217 and is currently estimated at $129,641, approximately $132 per square foot. 309 Georgia Ave Unit 311 is a home located in Alamance County with nearby schools including Eastlawn Elementary School, Broadview Middle School, and Hugh M. Cummings High School.
Ownership History
Date
Name
Owned For
Owner Type
Purchase Details
Closed on
Jan 31, 2025
Sold by
Orozco Properties Llc
Bought by
Lugui Main Street Llc
Current Estimated Value
Home Financials for this Owner
Home Financials are based on the most recent Mortgage that was taken out on this home.
Original Mortgage
$160,000
Outstanding Balance
$159,014
Interest Rate
6.72%
Mortgage Type
New Conventional
Estimated Equity
-$29,373
Purchase Details
Closed on
Jan 10, 2025
Sold by
Dove Joey Wayne
Bought by
Orozco Properties Llc
Home Financials for this Owner
Home Financials are based on the most recent Mortgage that was taken out on this home.
Original Mortgage
$160,000
Outstanding Balance
$159,014
Interest Rate
6.72%
Mortgage Type
New Conventional
Estimated Equity
-$29,373
Create a Home Valuation Report for This Property
The Home Valuation Report is an in-depth analysis detailing your home's value as well as a comparison with similar homes in the area
Home Values in the Area
Average Home Value in this Area
Purchase History
| Date | Buyer | Sale Price | Title Company |
|---|---|---|---|
| Lugui Main Street Llc | -- | None Listed On Document | |
| Lugui Main Street Llc | -- | None Listed On Document | |
| Orozco Properties Llc | $130,000 | None Listed On Document | |
| Orozco Properties Llc | $130,000 | None Listed On Document |
Source: Public Records
Mortgage History
| Date | Status | Borrower | Loan Amount |
|---|---|---|---|
| Open | Lugui Main Street Llc | $160,000 | |
| Closed | Lugui Main Street Llc | $160,000 | |
| Closed | Orozco Properties Llc | $110,000 |
Source: Public Records
Tax History Compared to Growth
Tax History
| Year | Tax Paid | Tax Assessment Tax Assessment Total Assessment is a certain percentage of the fair market value that is determined by local assessors to be the total taxable value of land and additions on the property. | Land | Improvement |
|---|---|---|---|---|
| 2025 | $510 | $103,305 | $15,000 | $88,305 |
| 2024 | $485 | $103,305 | $15,000 | $88,305 |
| 2023 | $941 | $103,305 | $15,000 | $88,305 |
| 2022 | $705 | $56,783 | $15,000 | $41,783 |
| 2021 | $710 | $56,783 | $15,000 | $41,783 |
| 2020 | $716 | $56,783 | $15,000 | $41,783 |
| 2019 | $359 | $56,783 | $15,000 | $41,783 |
| 2018 | $169 | $56,783 | $15,000 | $41,783 |
| 2017 | $669 | $56,783 | $15,000 | $41,783 |
| 2016 | $838 | $72,243 | $15,000 | $57,243 |
| 2015 | -- | $72,243 | $15,000 | $57,243 |
| 2014 | -- | $72,243 | $15,000 | $57,243 |
Source: Public Records
Map
Nearby Homes
- 506 Piedmont Way
- 520 Delaware Ave
- 213 Columbia Ave
- 505 Brookline Dr
- 725 S Beaumont Ave
- 625 Columbia Ave
- 208 S Saint John St
- 1509 Vaughn Rd
- 517 Jones St
- 918 Harris St
- 1332 Graham St
- 1726 Oklahoma Ave
- 813 N Main St
- 00 Baldwin Rd
- 178 Gilmer St
- 424 Camp Rd
- 801 N Mebane St
- 924 E Market St
- 625 N Mebane St
- 616 N Mebane St
- 307 Georgia Ave
- 307 Georgia Ave Unit A & B
- 313 Georgia Ave
- 315 Georgia Ave
- 1317 Rainey St
- 1309 Rainey St
- 1136 Cedar Crest Dr
- 1041 Cedar Crest Dr
- 314 Piedmont Way
- 406 Piedmont Way
- 319 Georgia Ave
- 410 Piedmont Way
- 310 & 312 Georgia Ave Unit 310-312
- 310 & 312 Georgia Ave
- 310 Georgia Ave Unit 31
- 1323 Rainey St
- 314 Georgia Ave
- 318 Georgia Ave
- 414 Piedmont Way
- 322 Georgia Ave