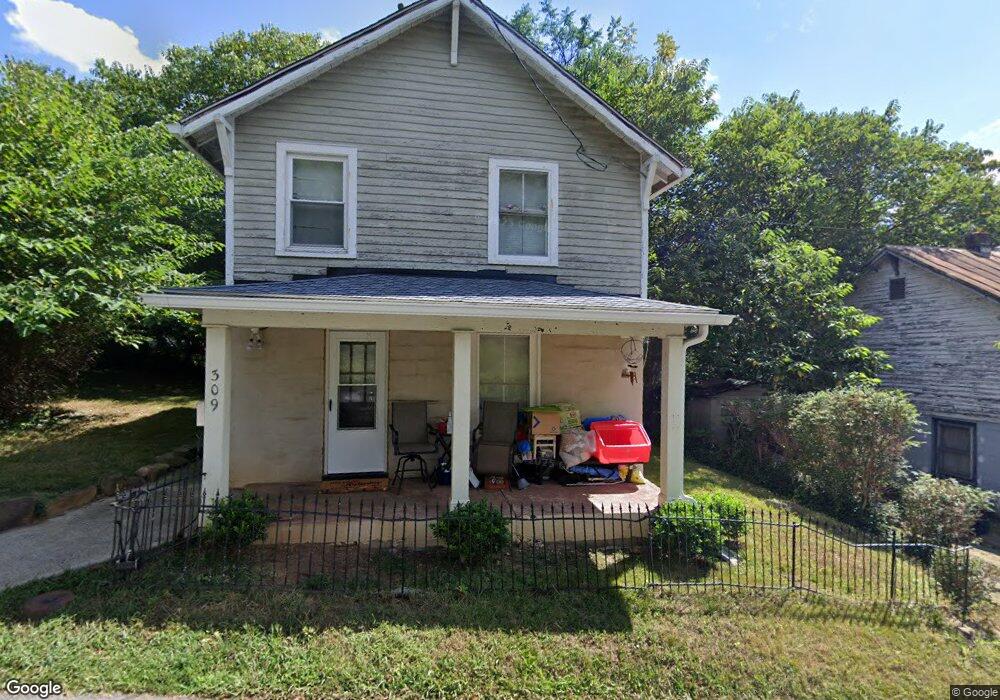
309 H St Lynchburg, VA 24504
Daniel's Hill NeighborhoodEstimated Value: $68,000 - $142,000
2
Beds
2
Baths
960
Sq Ft
$119/Sq Ft
Est. Value
About This Home
This home is located at 309 H St, Lynchburg, VA 24504 and is currently estimated at $114,487, approximately $119 per square foot. 309 H St is a home located in Lynchburg City with nearby schools including Linkhorne Elementary School, Linkhorne Middle School, and E.C. Glass High School.
Ownership History
Date
Name
Owned For
Owner Type
Purchase Details
Closed on
Aug 15, 2007
Sold by
Reilly Brian
Bought by
Henderson Audrey L
Current Estimated Value
Home Financials for this Owner
Home Financials are based on the most recent Mortgage that was taken out on this home.
Original Mortgage
$63,500
Outstanding Balance
$40,369
Interest Rate
6.74%
Mortgage Type
New Conventional
Estimated Equity
$74,118
Purchase Details
Closed on
Nov 20, 2006
Sold by
Mordel Properties Inc
Bought by
Reilly Brian
Purchase Details
Closed on
Jan 2, 2006
Sold by
Smith Ronnie D
Bought by
Mordel Properties Inc
Create a Home Valuation Report for This Property
The Home Valuation Report is an in-depth analysis detailing your home's value as well as a comparison with similar homes in the area
Home Values in the Area
Average Home Value in this Area
Purchase History
| Date | Buyer | Sale Price | Title Company |
|---|---|---|---|
| Henderson Audrey L | -- | None Available | |
| Reilly Brian | -- | None Available | |
| Mordel Properties Inc | -- | None Available |
Source: Public Records
Mortgage History
| Date | Status | Borrower | Loan Amount |
|---|---|---|---|
| Open | Henderson Audrey L | $63,500 |
Source: Public Records
Tax History Compared to Growth
Tax History
| Year | Tax Paid | Tax Assessment Tax Assessment Total Assessment is a certain percentage of the fair market value that is determined by local assessors to be the total taxable value of land and additions on the property. | Land | Improvement |
|---|---|---|---|---|
| 2025 | $606 | $72,100 | $12,000 | $60,100 |
| 2024 | $611 | $68,600 | $11,200 | $57,400 |
| 2023 | $611 | $68,600 | $11,200 | $57,400 |
| 2022 | $655 | $63,600 | $9,000 | $54,600 |
| 2021 | $706 | $63,600 | $9,000 | $54,600 |
| 2020 | $571 | $51,400 | $6,000 | $45,400 |
| 2019 | $571 | $51,400 | $6,000 | $45,400 |
| 2018 | $554 | $49,900 | $4,500 | $45,400 |
| 2017 | $554 | $49,900 | $4,500 | $45,400 |
| 2016 | $554 | $49,900 | $4,500 | $45,400 |
| 2015 | $554 | $51,100 | $4,500 | $46,600 |
| 2014 | $567 | $51,100 | $4,500 | $46,600 |
Source: Public Records
Map
Nearby Homes