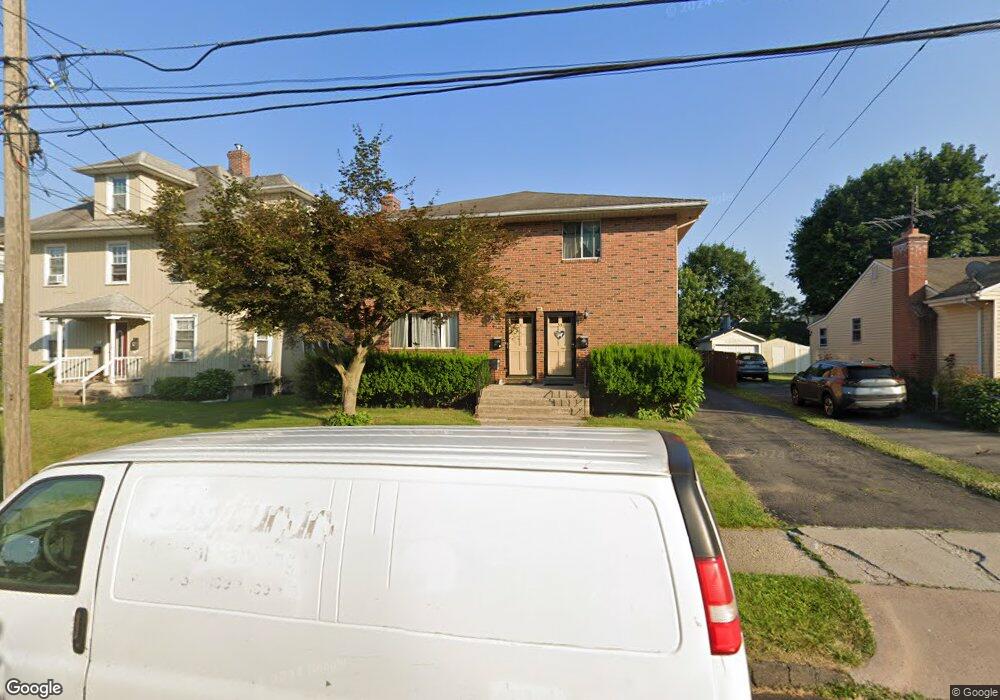
31 Chapman St Unit 33 Hartford, CT 06114
South End NeighborhoodEstimated Value: $343,470 - $554,000
6
Beds
4
Baths
3,122
Sq Ft
$138/Sq Ft
Est. Value
About This Home
This home is located at 31 Chapman St Unit 33, Hartford, CT 06114 and is currently estimated at $431,368, approximately $138 per square foot. 31 Chapman St Unit 33 is a home located in Hartford County with nearby schools including Kennelly School, Environmental Sciences Magnet School at Mary Hooker, and Sanchez School.
Ownership History
Date
Name
Owned For
Owner Type
Purchase Details
Closed on
Nov 22, 2006
Sold by
Robles Jessica and Arteaga Carmen
Bought by
Sanchez Marisol
Current Estimated Value
Home Financials for this Owner
Home Financials are based on the most recent Mortgage that was taken out on this home.
Original Mortgage
$295,000
Outstanding Balance
$175,350
Interest Rate
6.39%
Mortgage Type
Purchase Money Mortgage
Estimated Equity
$256,018
Purchase Details
Closed on
May 3, 2005
Sold by
Est Deluca Angela and Deluca Crescenzo
Bought by
Robles Jessica
Home Financials for this Owner
Home Financials are based on the most recent Mortgage that was taken out on this home.
Original Mortgage
$208,000
Interest Rate
6.75%
Create a Home Valuation Report for This Property
The Home Valuation Report is an in-depth analysis detailing your home's value as well as a comparison with similar homes in the area
Home Values in the Area
Average Home Value in this Area
Purchase History
| Date | Buyer | Sale Price | Title Company |
|---|---|---|---|
| Sanchez Marisol | $295,000 | -- | |
| Robles Jessica | $260,000 | -- |
Source: Public Records
Mortgage History
| Date | Status | Borrower | Loan Amount |
|---|---|---|---|
| Open | Robles Jessica | $295,000 | |
| Previous Owner | Robles Jessica | $208,000 | |
| Previous Owner | Robles Jessica | $52,000 |
Source: Public Records
Tax History Compared to Growth
Tax History
| Year | Tax Paid | Tax Assessment Tax Assessment Total Assessment is a certain percentage of the fair market value that is determined by local assessors to be the total taxable value of land and additions on the property. | Land | Improvement |
|---|---|---|---|---|
| 2025 | $7,696 | $111,610 | $7,828 | $103,782 |
| 2024 | $7,696 | $111,610 | $7,828 | $103,782 |
| 2023 | $7,696 | $111,610 | $7,828 | $103,782 |
| 2022 | $7,696 | $111,610 | $7,828 | $103,782 |
| 2021 | $5,915 | $79,625 | $10,710 | $68,915 |
| 2020 | $5,915 | $79,625 | $10,710 | $68,915 |
| 2019 | $5,915 | $79,625 | $10,710 | $68,915 |
| 2018 | $5,716 | $76,941 | $10,349 | $66,592 |
| 2016 | $5,602 | $75,404 | $9,857 | $65,547 |
| 2015 | $5,336 | $71,822 | $9,388 | $62,434 |
| 2014 | $5,205 | $70,066 | $9,158 | $60,908 |
Source: Public Records
Map
Nearby Homes
- 308 Brown St
- 159 Gilman St
- 218 Grandview Terrace Unit 220
- 405 W Preston St Unit 407
- 147 Newbury St Unit 149
- 185 Grandview Terrace Unit 187
- 90 Harwich St Unit 92
- 35 Clifford St
- 390 Fairfield Ave
- 46 Harwich St
- 152 Otis St
- 90 Salem St
- 183 Preston St Unit 185
- 49 Newbury St Unit 51
- 73 Mountford St Unit 3B
- 69 Mountford St Unit 3A
- 474 Hillside Ave
- 147 Preston St Unit 1
- 148 Princeton St
- 389 Hillside Ave
- 29 Chapman St
- 35 Chapman St
- 15 Chapman St
- 32 Chapman St
- 36 Chapman St
- 39 Chapman St Unit 41
- 22 Linnmoore St
- 40 Chapman St
- 18 Linnmoore St
- 26 Linnmoore St
- 24 Chapman St
- 12 Linnmoore St Unit 14
- 30 Linnmoore St
- 13 Chapman St
- 43 Chapman St
- 44 Chapman St
- 17 Chapman St Unit 19
- 20 Chapman St Unit 22
- 915 Maple Ave
- 34 Linnmoore St