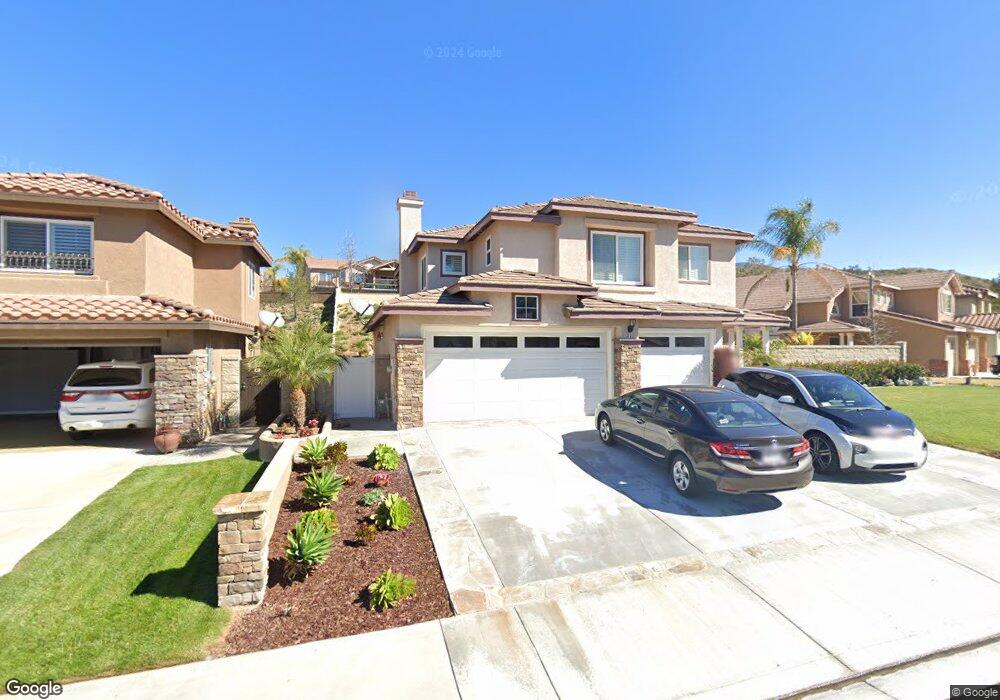
31 Moccasin Trail Trabuco Canyon, CA 92679
Estimated Value: $1,224,000 - $1,387,194
5
Beds
4
Baths
2,029
Sq Ft
$647/Sq Ft
Est. Value
About This Home
This home is located at 31 Moccasin Trail, Trabuco Canyon, CA 92679 and is currently estimated at $1,312,549, approximately $646 per square foot. 31 Moccasin Trail is a home located in Orange County with nearby schools including Portola Hills Elementary School, Serrano Intermediate School, and Trabuco Hills High School.
Ownership History
Date
Name
Owned For
Owner Type
Purchase Details
Closed on
Jun 7, 2007
Sold by
Pizarroso Sylvia L
Bought by
Bissland Ronald T and Pizarroso Sylvia L
Current Estimated Value
Home Financials for this Owner
Home Financials are based on the most recent Mortgage that was taken out on this home.
Original Mortgage
$676,000
Interest Rate
6.12%
Mortgage Type
New Conventional
Purchase Details
Closed on
Sep 13, 2006
Sold by
Pizarroso Sylvia L and Perez Sylvia L
Bought by
Pizarroso Sylvia L
Home Financials for this Owner
Home Financials are based on the most recent Mortgage that was taken out on this home.
Original Mortgage
$200,000
Interest Rate
6.56%
Mortgage Type
Credit Line Revolving
Purchase Details
Closed on
Dec 28, 2004
Sold by
Perez Frank
Bought by
Perez Sylvia L
Home Financials for this Owner
Home Financials are based on the most recent Mortgage that was taken out on this home.
Original Mortgage
$465,000
Interest Rate
5.75%
Mortgage Type
New Conventional
Create a Home Valuation Report for This Property
The Home Valuation Report is an in-depth analysis detailing your home's value as well as a comparison with similar homes in the area
Home Values in the Area
Average Home Value in this Area
Purchase History
| Date | Buyer | Sale Price | Title Company |
|---|---|---|---|
| Bissland Ronald T | -- | First American Title | |
| Pizarroso Sylvia L | -- | First American Title Ins Co | |
| Perez Sylvia L | -- | North American Title Co |
Source: Public Records
Mortgage History
| Date | Status | Borrower | Loan Amount |
|---|---|---|---|
| Closed | Bissland Ronald T | $676,000 | |
| Closed | Pizarroso Sylvia L | $200,000 | |
| Closed | Perez Sylvia L | $465,000 |
Source: Public Records
Tax History Compared to Growth
Tax History
| Year | Tax Paid | Tax Assessment Tax Assessment Total Assessment is a certain percentage of the fair market value that is determined by local assessors to be the total taxable value of land and additions on the property. | Land | Improvement |
|---|---|---|---|---|
| 2025 | $4,621 | $456,354 | $111,484 | $344,870 |
| 2024 | $4,621 | $447,406 | $109,298 | $338,108 |
| 2023 | $4,512 | $438,634 | $107,155 | $331,479 |
| 2022 | $4,431 | $430,034 | $105,054 | $324,980 |
| 2021 | $4,343 | $421,602 | $102,994 | $318,608 |
| 2020 | $4,305 | $417,279 | $101,937 | $315,342 |
| 2019 | $4,219 | $409,098 | $99,939 | $309,159 |
| 2018 | $4,140 | $401,077 | $97,979 | $303,098 |
| 2017 | $4,058 | $393,213 | $96,058 | $297,155 |
| 2016 | $3,991 | $385,503 | $94,174 | $291,329 |
| 2015 | $3,950 | $379,713 | $92,760 | $286,953 |
| 2014 | $3,864 | $372,275 | $90,943 | $281,332 |
Source: Public Records
Map
Nearby Homes
- 12 Cielo Prado
- 5 Via Taliana
- 2 Via Bandada
- 17 Via Anadeja
- 1841 Aliso Canyon Dr
- 2218 Arroyo Trabuco Ct
- 5807 Sunrise Ridge Ln
- 1883 Aliso Canyon Dr
- 5787 Sunrise Ridge Ln
- 1901 Aliso Canyon Dr
- 5767 Sunrise Ridge Ln
- 29011 Canyon Vista Dr
- 19331 Sleeping Oak Dr
- 3017 Viejo Ridge Dr
- 19311 Sleeping Oak Dr
- 141 Mira Mesa
- 28552 Sorano Cove
- 19605 Live Oak Canyon Rd
- 19121 El Toro Rd
- 28516 Sorano Cove
- 35 Moccasin Trail
- 27 Moccasin Trail
- 25 Moccasin Trail
- 9 Sagewood Ln
- 11 Sagewood Ln
- 37 Moccasin Trail
- 30 Moccasin Trail
- 7 Sagewood Ln
- 32 Moccasin Trail
- 28 Moccasin Trail
- 13 Sagewood Ln
- 23 Moccasin Trail
- 34 Moccasin Trail
- 26 Moccasin Trail
- 5 Sagewood Ln
- 24 Moccasin Trail
- 36 Moccasin Trail
- 21 Moccasin Trail
- 15 Sagewood Ln
- 22 Moccasin Trail