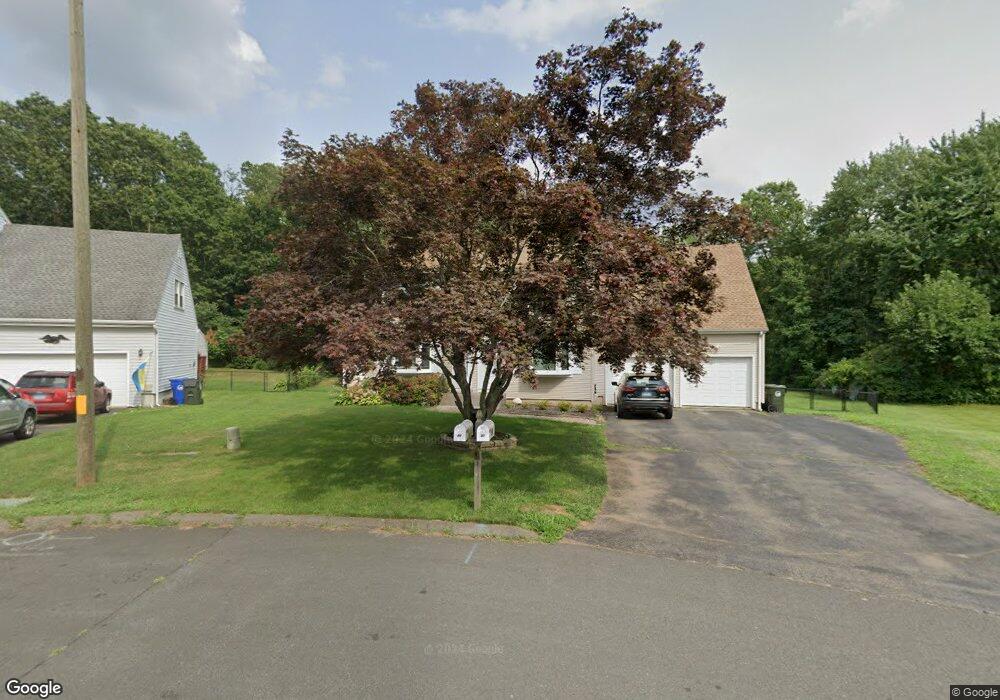
31 Spur Ln Newington, CT 06111
Estimated Value: $408,000 - $512,000
5
Beds
4
Baths
2,496
Sq Ft
$190/Sq Ft
Est. Value
About This Home
This home is located at 31 Spur Ln, Newington, CT 06111 and is currently estimated at $474,284, approximately $190 per square foot. 31 Spur Ln is a home located in Hartford County with nearby schools including John Paterson School, John Wallace Middle School, and Newington High School.
Ownership History
Date
Name
Owned For
Owner Type
Purchase Details
Closed on
Sep 5, 2019
Sold by
Calafiore Paolo
Bought by
Calafiore Paolo and Calafiore Monika
Current Estimated Value
Home Financials for this Owner
Home Financials are based on the most recent Mortgage that was taken out on this home.
Original Mortgage
$273,000
Outstanding Balance
$238,603
Interest Rate
3.6%
Mortgage Type
New Conventional
Estimated Equity
$235,681
Purchase Details
Closed on
Jul 6, 2015
Sold by
Moscaritolo Paul R and Moscaritolo Alicia M
Bought by
Calafiore Paolo
Home Financials for this Owner
Home Financials are based on the most recent Mortgage that was taken out on this home.
Original Mortgage
$288,674
Interest Rate
3.99%
Mortgage Type
FHA
Purchase Details
Closed on
Jul 29, 2002
Sold by
Castanho Luis
Bought by
Moscaritolo Paul R and Moscaritolo Alicia M
Purchase Details
Closed on
Aug 24, 1995
Sold by
Lombardi Carolyn and Lombardi Donald J
Bought by
Castanho Luis
Create a Home Valuation Report for This Property
The Home Valuation Report is an in-depth analysis detailing your home's value as well as a comparison with similar homes in the area
Home Values in the Area
Average Home Value in this Area
Purchase History
| Date | Buyer | Sale Price | Title Company |
|---|---|---|---|
| Calafiore Paolo | -- | -- | |
| Calafiore Paolo | $294,000 | -- | |
| Moscaritolo Paul R | $264,000 | -- | |
| Castanho Luis | $181,500 | -- |
Source: Public Records
Mortgage History
| Date | Status | Borrower | Loan Amount |
|---|---|---|---|
| Open | Calafiore Paolo | $273,000 | |
| Previous Owner | Calafiore Paolo | $288,674 | |
| Previous Owner | Castanho Luis | $269,684 | |
| Previous Owner | Castanho Luis | $40,000 |
Source: Public Records
Tax History Compared to Growth
Tax History
| Year | Tax Paid | Tax Assessment Tax Assessment Total Assessment is a certain percentage of the fair market value that is determined by local assessors to be the total taxable value of land and additions on the property. | Land | Improvement |
|---|---|---|---|---|
| 2025 | $8,104 | $202,710 | $57,330 | $145,380 |
| 2024 | $8,042 | $202,710 | $57,330 | $145,380 |
| 2023 | $7,776 | $202,710 | $57,330 | $145,380 |
| 2022 | $7,802 | $202,710 | $57,330 | $145,380 |
| 2021 | $7,867 | $202,710 | $57,330 | $145,380 |
| 2020 | $7,440 | $189,400 | $57,330 | $132,070 |
| 2019 | $7,472 | $189,400 | $57,330 | $132,070 |
| 2018 | $7,292 | $189,400 | $57,330 | $132,070 |
| 2017 | $6,930 | $189,400 | $57,330 | $132,070 |
| 2016 | $6,771 | $189,400 | $57,330 | $132,070 |
| 2015 | $6,983 | $195,060 | $62,870 | $132,190 |
| 2014 | $6,782 | $195,060 | $62,870 | $132,190 |
Source: Public Records
Map
Nearby Homes
- 61 Long St
- 235 Orchard Ave
- 660/674 Church Rear St
- 57 Stonehedge Dr
- 17 Pike St
- 26 Pickens Dr
- 28 Kulper Rd
- 45 Dunlay St
- 33 Dunlay St
- 212 Church St
- 46 Konstin Place Unit A
- 103 Hickory Hill Ln
- 27 Konstin Place
- 303 New Britain Rd
- 31 Chapman St
- 142 Henry St
- 83 Henry St
- 516 Wethersfield Rd
- 110 Austin St
- 170 Church St