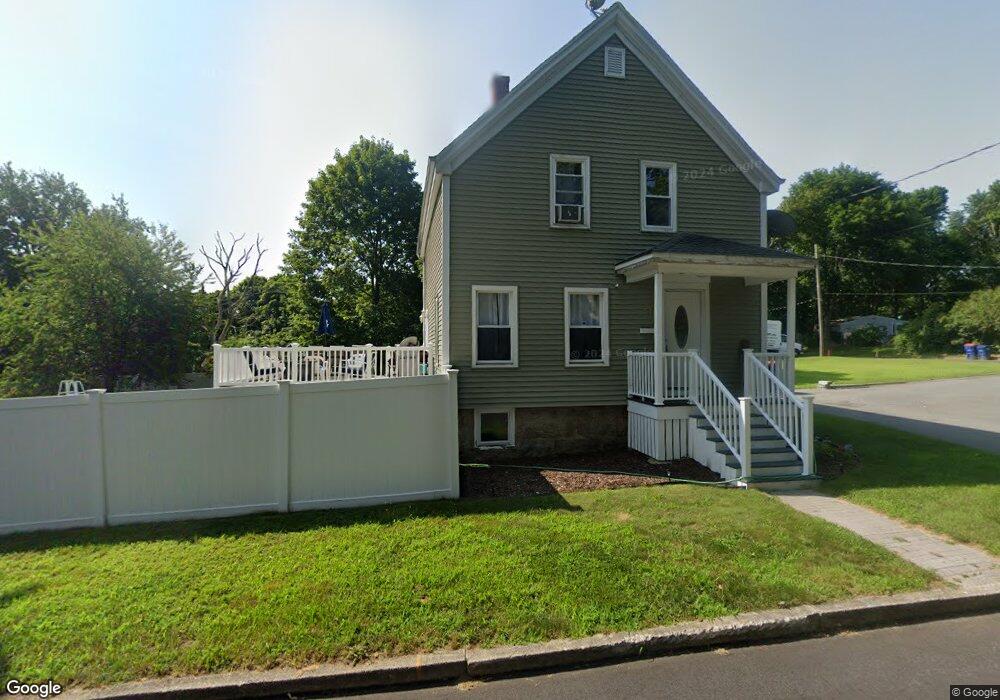
31 Wilding St Fairhaven, MA 02719
North Fairhaven NeighborhoodEstimated Value: $430,000 - $537,000
3
Beds
2
Baths
1,233
Sq Ft
$380/Sq Ft
Est. Value
About This Home
This home is located at 31 Wilding St, Fairhaven, MA 02719 and is currently estimated at $468,971, approximately $380 per square foot. 31 Wilding St is a home located in Bristol County with nearby schools including Fairhaven High School, Alma Del Mar Charter School, and St. Joseph School.
Ownership History
Date
Name
Owned For
Owner Type
Purchase Details
Closed on
Nov 3, 2011
Sold by
Arruda Antone
Bought by
Lovegrove Christopher M
Current Estimated Value
Purchase Details
Closed on
Nov 30, 2001
Sold by
Mahar Shawn G
Bought by
Camposano Martin and Machie Bonnie L
Purchase Details
Closed on
Sep 27, 1999
Sold by
Oliver Sheila M
Bought by
Mahar Shawn
Create a Home Valuation Report for This Property
The Home Valuation Report is an in-depth analysis detailing your home's value as well as a comparison with similar homes in the area
Home Values in the Area
Average Home Value in this Area
Purchase History
| Date | Buyer | Sale Price | Title Company |
|---|---|---|---|
| Lovegrove Christopher M | $235,000 | -- | |
| Camposano Martin | $169,900 | -- | |
| Mahar Shawn | $100,000 | -- |
Source: Public Records
Mortgage History
| Date | Status | Borrower | Loan Amount |
|---|---|---|---|
| Previous Owner | Mahar Shawn | $202,500 | |
| Previous Owner | Mahar Shawn | $169,349 |
Source: Public Records
Tax History Compared to Growth
Tax History
| Year | Tax Paid | Tax Assessment Tax Assessment Total Assessment is a certain percentage of the fair market value that is determined by local assessors to be the total taxable value of land and additions on the property. | Land | Improvement |
|---|---|---|---|---|
| 2025 | $36 | $381,600 | $179,400 | $202,200 |
| 2024 | $3,427 | $371,300 | $179,400 | $191,900 |
| 2023 | $3,344 | $336,100 | $157,200 | $178,900 |
| 2022 | $3,234 | $316,400 | $146,100 | $170,300 |
| 2021 | $3,078 | $272,600 | $132,200 | $140,400 |
| 2020 | $3,015 | $272,600 | $132,200 | $140,400 |
| 2019 | $5,695 | $238,700 | $109,700 | $129,000 |
| 2018 | $2,658 | $226,200 | $104,500 | $121,700 |
| 2017 | $5,140 | $216,300 | $104,500 | $111,800 |
| 2016 | $2,513 | $206,300 | $104,500 | $101,800 |
| 2015 | $2,480 | $204,100 | $104,500 | $99,600 |
Source: Public Records
Map
Nearby Homes