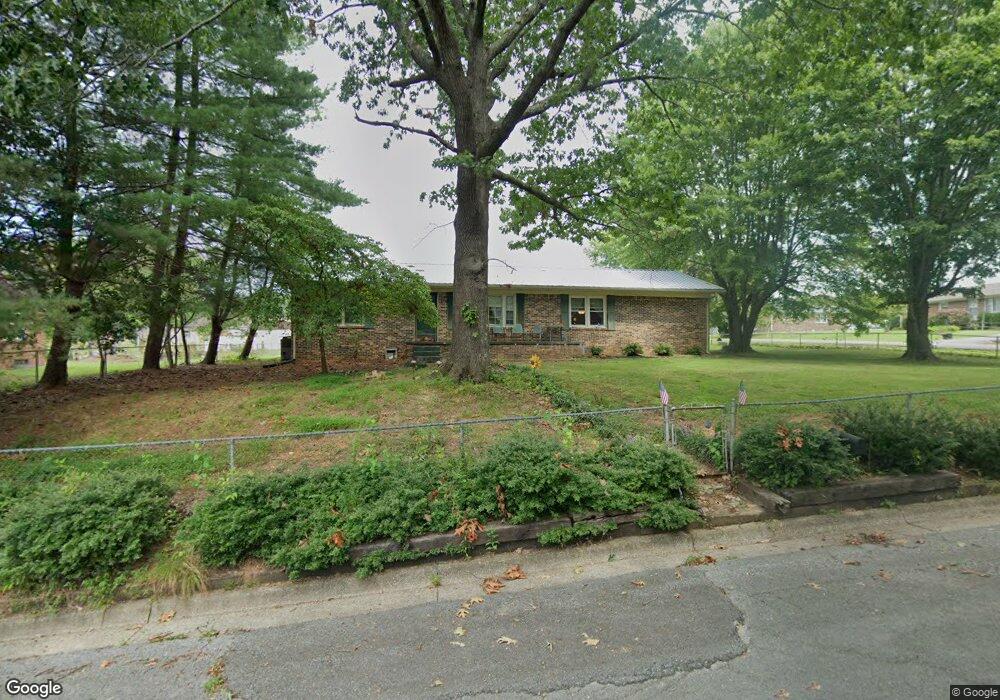
310 Avon St Lawrenceburg, TN 38464
Estimated Value: $180,448 - $230,000
--
Bed
2
Baths
1,563
Sq Ft
$138/Sq Ft
Est. Value
About This Home
This home is located at 310 Avon St, Lawrenceburg, TN 38464 and is currently estimated at $215,862, approximately $138 per square foot. 310 Avon St is a home located in Lawrence County with nearby schools including Ingram Sowell Elementary School, David Crockett Elementary School, and Lawrenceburg Public Elementary School.
Ownership History
Date
Name
Owned For
Owner Type
Purchase Details
Closed on
Apr 17, 2017
Sold by
Reynolds Lynn M
Bought by
Norton Oliver E and Norton Victoria
Current Estimated Value
Purchase Details
Closed on
May 9, 1997
Sold by
Barry Green
Bought by
Reynolds Lynn M
Home Financials for this Owner
Home Financials are based on the most recent Mortgage that was taken out on this home.
Original Mortgage
$52,250
Interest Rate
8.17%
Purchase Details
Closed on
Dec 3, 1986
Bought by
Green Barry and Wife Tina
Purchase Details
Closed on
Jan 1, 1978
Create a Home Valuation Report for This Property
The Home Valuation Report is an in-depth analysis detailing your home's value as well as a comparison with similar homes in the area
Home Values in the Area
Average Home Value in this Area
Purchase History
| Date | Buyer | Sale Price | Title Company |
|---|---|---|---|
| Norton Oliver E | $65,000 | -- | |
| Reynolds Lynn M | $55,000 | -- | |
| Green Barry | $32,000 | -- | |
| -- | $33,500 | -- |
Source: Public Records
Mortgage History
| Date | Status | Borrower | Loan Amount |
|---|---|---|---|
| Previous Owner | Not Available | $52,250 |
Source: Public Records
Tax History Compared to Growth
Tax History
| Year | Tax Paid | Tax Assessment Tax Assessment Total Assessment is a certain percentage of the fair market value that is determined by local assessors to be the total taxable value of land and additions on the property. | Land | Improvement |
|---|---|---|---|---|
| 2025 | $1,081 | $34,775 | $0 | $0 |
| 2024 | $1,081 | $34,775 | $2,500 | $32,275 |
| 2023 | $1,081 | $34,775 | $2,500 | $32,275 |
| 2022 | $1,081 | $34,775 | $2,500 | $32,275 |
| 2021 | $886 | $20,150 | $2,000 | $18,150 |
| 2020 | $886 | $20,150 | $2,000 | $18,150 |
| 2019 | $886 | $20,150 | $2,000 | $18,150 |
| 2018 | $886 | $20,150 | $2,000 | $18,150 |
| 2017 | $886 | $20,150 | $2,000 | $18,150 |
| 2016 | $886 | $20,150 | $2,000 | $18,150 |
| 2015 | $839 | $20,150 | $2,000 | $18,150 |
| 2014 | $804 | $19,325 | $2,000 | $17,325 |
Source: Public Records
Map
Nearby Homes