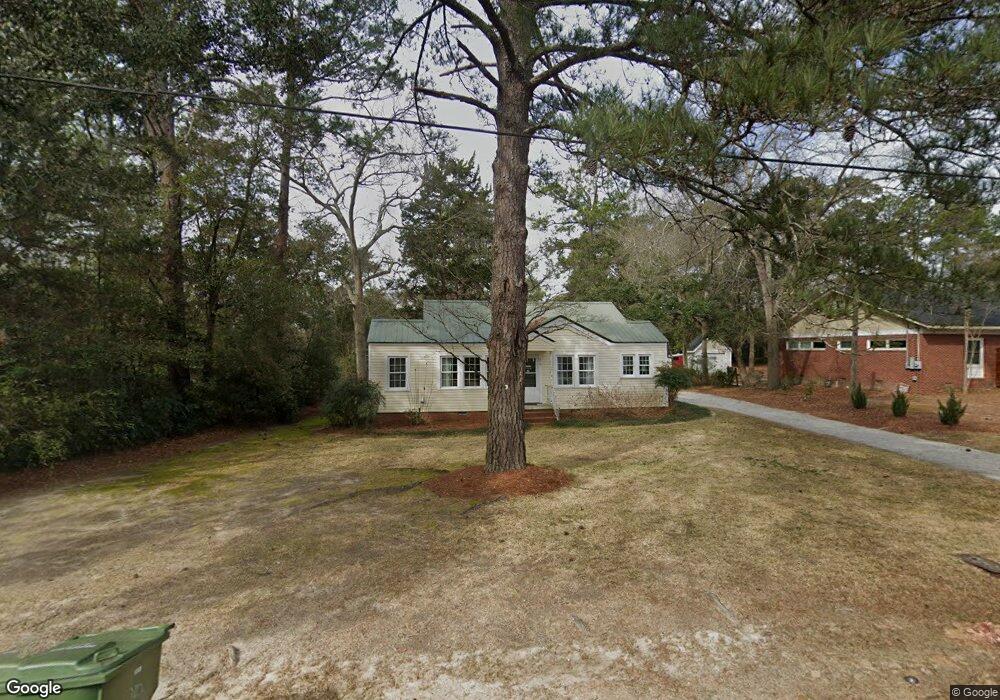
310 Donehoo St Statesboro, GA 30458
Estimated Value: $154,000 - $195,000
3
Beds
1
Bath
954
Sq Ft
$180/Sq Ft
Est. Value
About This Home
This home is located at 310 Donehoo St, Statesboro, GA 30458 and is currently estimated at $171,332, approximately $179 per square foot. 310 Donehoo St is a home located in Bulloch County with nearby schools including Statesboro High School, Sallie Zetterower Elementary School, and Langston Chapel Middle School.
Ownership History
Date
Name
Owned For
Owner Type
Purchase Details
Closed on
Oct 27, 2021
Sold by
Wheels Up Investments Llc
Bought by
Kbp Investments Llc
Current Estimated Value
Home Financials for this Owner
Home Financials are based on the most recent Mortgage that was taken out on this home.
Original Mortgage
$358,270
Outstanding Balance
$220,350
Interest Rate
3.01%
Mortgage Type
New Conventional
Estimated Equity
-$49,018
Purchase Details
Closed on
Dec 6, 2019
Sold by
Newman Paul
Bought by
Wheels Up Investments Inc
Purchase Details
Closed on
Jan 26, 2018
Sold by
Hodges Mary J
Bought by
Wheels Up Investments Inc
Home Financials for this Owner
Home Financials are based on the most recent Mortgage that was taken out on this home.
Original Mortgage
$86,613
Interest Rate
3.99%
Mortgage Type
New Conventional
Purchase Details
Closed on
Apr 1, 1978
Bought by
Hodges Mary J
Create a Home Valuation Report for This Property
The Home Valuation Report is an in-depth analysis detailing your home's value as well as a comparison with similar homes in the area
Home Values in the Area
Average Home Value in this Area
Purchase History
| Date | Buyer | Sale Price | Title Company |
|---|---|---|---|
| Kbp Investments Llc | $115,000 | -- | |
| Wheels Up Investments Inc | -- | -- | |
| Wheels Up Investments Inc | $52,500 | -- | |
| Hodges Mary J | -- | -- |
Source: Public Records
Mortgage History
| Date | Status | Borrower | Loan Amount |
|---|---|---|---|
| Open | Kbp Investments Llc | $358,270 | |
| Previous Owner | Wheels Up Investments Inc | $86,613 |
Source: Public Records
Tax History Compared to Growth
Tax History
| Year | Tax Paid | Tax Assessment Tax Assessment Total Assessment is a certain percentage of the fair market value that is determined by local assessors to be the total taxable value of land and additions on the property. | Land | Improvement |
|---|---|---|---|---|
| 2024 | $1,401 | $51,108 | $6,000 | $45,108 |
| 2023 | $1,315 | $45,908 | $6,000 | $39,908 |
| 2022 | $762 | $38,837 | $6,000 | $32,837 |
| 2021 | $441 | $21,855 | $6,000 | $15,855 |
| 2020 | $454 | $21,889 | $6,920 | $14,969 |
| 2019 | $438 | $22,040 | $6,920 | $15,120 |
| 2018 | $457 | $21,010 | $6,920 | $14,090 |
| 2017 | $447 | $20,287 | $6,920 | $13,367 |
| 2016 | $445 | $19,708 | $6,920 | $12,788 |
| 2015 | $262 | $19,233 | $6,920 | $12,313 |
| 2014 | $234 | $18,284 | $6,920 | $11,364 |
Source: Public Records
Map
Nearby Homes
- 607 E Jones Ave
- 403 Granade St
- 342 Savannah Ave
- 360 Savannah Ave
- 203 Gentilly Rd
- 105 Griffith Ln Unit LOT 76
- 311 S Zetterower Ave
- 141 Griffith Ln
- 118 Lee St
- 9 Broad St
- 0 Northside Dr E Unit 10610985
- 2 Ed Moore Ct
- 316 E Main St
- 41.43 ACRES Georgia 67
- 5 ACRES Georgia 67
- 112 Stratford St
- 513 Winter Way
- LOT 21 Oak Hill Dr
- 0 Highway 67 Unit 10541885
- 0 W Inman St Unit 10636708
- 308 Donehoo St Unit 10
- 308 Donehoo St
- 609 E Jones Ave
- 306 Donehoo St
- 312 Park Ave
- 310 Park Ave
- 608 E Jones Ave
- 0 Donehoo St Unit 7101220
- 0 Donehoo St Unit 2646752
- 0 Donehoo St Unit 3130119
- 0 Donehoo St Unit 8387920
- 0 Donehoo St Unit 8414984
- 0 Donehoo St Unit 2583453
- 0 Donehoo St Unit 3264273
- 0 Donehoo St Unit 7050904
- 0 Donehoo St Unit 7387116
- 610 E Jones Ave
- 309 Donehoo St
- 315A Donehoo St
- 308 Park Ave