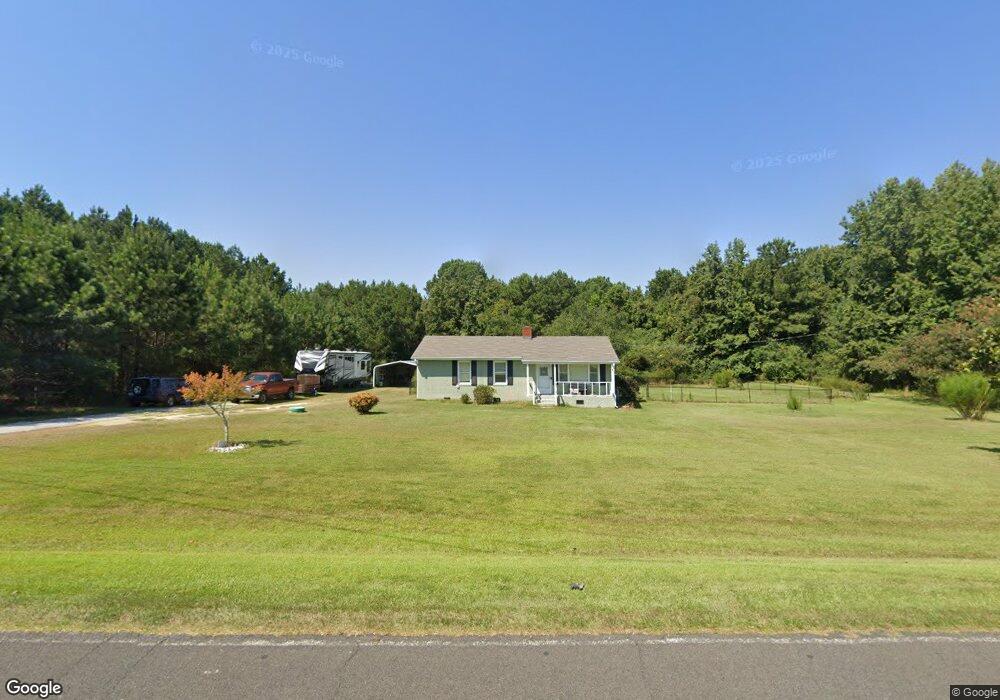
310 Frazier Rd Youngsville, NC 27596
Estimated Value: $185,000 - $234,956
3
Beds
1
Bath
1,025
Sq Ft
$216/Sq Ft
Est. Value
About This Home
This home is located at 310 Frazier Rd, Youngsville, NC 27596 and is currently estimated at $220,989, approximately $215 per square foot. 310 Frazier Rd is a home located in Franklin County with nearby schools including Royal Elementary School, Bunn Middle School, and Bunn High School.
Ownership History
Date
Name
Owned For
Owner Type
Purchase Details
Closed on
Jan 19, 2021
Sold by
Mullins Robert Craig
Bought by
Trevillian Andrew Hunter
Current Estimated Value
Home Financials for this Owner
Home Financials are based on the most recent Mortgage that was taken out on this home.
Original Mortgage
$153,672
Outstanding Balance
$136,838
Interest Rate
2.71%
Mortgage Type
New Conventional
Estimated Equity
$84,151
Purchase Details
Closed on
Dec 1, 2020
Sold by
Rogers Stanley Yann and Rogers Stacey K
Bought by
Mullins Robert Craig
Home Financials for this Owner
Home Financials are based on the most recent Mortgage that was taken out on this home.
Original Mortgage
$153,672
Outstanding Balance
$136,838
Interest Rate
2.71%
Mortgage Type
New Conventional
Estimated Equity
$84,151
Purchase Details
Closed on
Aug 30, 1993
Bought by
Mullins Robert Craig
Create a Home Valuation Report for This Property
The Home Valuation Report is an in-depth analysis detailing your home's value as well as a comparison with similar homes in the area
Home Values in the Area
Average Home Value in this Area
Purchase History
| Date | Buyer | Sale Price | Title Company |
|---|---|---|---|
| Trevillian Andrew Hunter | $162,000 | None Available | |
| Trevillian Andrew Hunter | $162,000 | None Listed On Document | |
| Mullins Robert Craig | -- | None Available | |
| Mullins Robert Craig | $47,500 | -- |
Source: Public Records
Mortgage History
| Date | Status | Borrower | Loan Amount |
|---|---|---|---|
| Open | Trevillian Andrew Hunter | $153,672 | |
| Closed | Trevillian Andrew Hunter | $153,672 |
Source: Public Records
Tax History Compared to Growth
Tax History
| Year | Tax Paid | Tax Assessment Tax Assessment Total Assessment is a certain percentage of the fair market value that is determined by local assessors to be the total taxable value of land and additions on the property. | Land | Improvement |
|---|---|---|---|---|
| 2025 | $1,039 | $162,930 | $51,000 | $111,930 |
| 2024 | $1,022 | $162,930 | $51,000 | $111,930 |
| 2023 | $980 | $101,150 | $27,820 | $73,330 |
| 2022 | $970 | $101,150 | $27,820 | $73,330 |
| 2021 | $981 | $101,150 | $27,820 | $73,330 |
| 2020 | $981 | $100,240 | $26,910 | $73,330 |
| 2019 | $961 | $100,240 | $26,910 | $73,330 |
| 2018 | $958 | $100,240 | $26,910 | $73,330 |
| 2017 | $761 | $70,850 | $22,430 | $48,420 |
| 2016 | $786 | $70,850 | $22,430 | $48,420 |
| 2015 | $786 | $70,850 | $22,430 | $48,420 |
| 2014 | $724 | $70,850 | $22,430 | $48,420 |
Source: Public Records
Map
Nearby Homes
- 10 Shorrey Place
- 20 Willows Den Ct
- 150 Williamston Ridge Dr
- 3555 Nc 98 Hwy W
- 65 Linnett Ct
- 85 Old Garden Ln
- 20 Richmond Place
- 40 Muirfield Dr
- 90 Eagle Chase Dr
- 50 Babbling Creek Dr
- 150 Babbling Creek Dr
- 85 Arbor Dr
- 25 Arbor Dr
- 136 Dixie Ln
- 138 Bridle Trail
- 0 S Us 401 Hwy
- 463 Robbins Rd
- 85 Weathered Oak Way
- 5916 2 Pines Trail
- 4822 N Carolina 98
- 270 Frazier Rd
- 352 Frazier Rd
- 234 Frazier Rd
- 328 Frazier Rd
- 0 Frazier Rd Unit 1744542
- 0 Frazier Rd Unit 1744546
- 0 Frazier Rd Unit 1779194
- 0 Frazier Rd Unit 1669087
- 00 Frazier Rd
- 0 Frazier Rd Unit A TR1669096
- 0 Frazier Rd Unit TR2208316
- 0 Frazier Rd Unit A 1669096
- 0 Frazier Rd Unit 1 1669087
- 00 Frazier Rd Unit B
- 0 Frazier Rd Unit 1 1744542
- 0 Frazier Rd Unit 2 1744546
- 0 Frazier Rd Unit 8 1779194
- 0 Frazier Rd
- 370 Frazier Rd
- 370 Frazier Rd