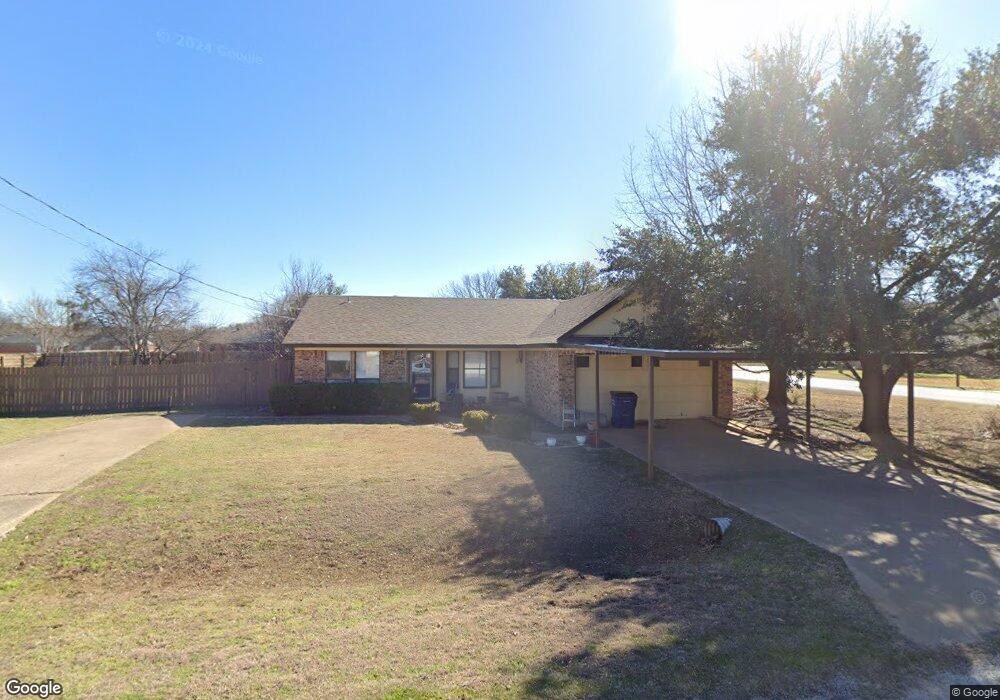
3100 Shady Grove Cir Granbury, TX 76049
Estimated Value: $259,000 - $293,000
--
Bed
--
Bath
1,362
Sq Ft
$202/Sq Ft
Est. Value
About This Home
This home is located at 3100 Shady Grove Cir, Granbury, TX 76049 and is currently estimated at $275,728, approximately $202 per square foot. 3100 Shady Grove Cir is a home located in Hood County with nearby schools including Oak Woods School, Acton Middle School, and Granbury High School.
Ownership History
Date
Name
Owned For
Owner Type
Purchase Details
Closed on
Mar 27, 2006
Sold by
Westbrook Timothy W and Westbrook Joannie J
Bought by
Durham Harold E and Durham Barbara J
Current Estimated Value
Home Financials for this Owner
Home Financials are based on the most recent Mortgage that was taken out on this home.
Original Mortgage
$78,400
Outstanding Balance
$44,162
Interest Rate
6.21%
Mortgage Type
New Conventional
Estimated Equity
$231,566
Purchase Details
Closed on
Dec 6, 2001
Sold by
Westbrook Timothy W and Westbrook Mourning
Bought by
Durham Harold E
Purchase Details
Closed on
Nov 13, 2001
Sold by
Stembridge Ava
Bought by
Durham Harold E
Purchase Details
Closed on
Mar 24, 1998
Sold by
Garrett Edwin E
Bought by
Durham Harold E
Purchase Details
Closed on
Mar 25, 1997
Sold by
Fournier Billy S
Bought by
Durham Harold E
Purchase Details
Closed on
Aug 1, 1986
Bought by
Durham Harold E
Create a Home Valuation Report for This Property
The Home Valuation Report is an in-depth analysis detailing your home's value as well as a comparison with similar homes in the area
Home Values in the Area
Average Home Value in this Area
Purchase History
| Date | Buyer | Sale Price | Title Company |
|---|---|---|---|
| Durham Harold E | -- | Central Texas Title | |
| Durham Harold E | -- | -- | |
| Durham Harold E | -- | -- | |
| Durham Harold E | -- | -- | |
| Durham Harold E | -- | -- | |
| Durham Harold E | -- | -- |
Source: Public Records
Mortgage History
| Date | Status | Borrower | Loan Amount |
|---|---|---|---|
| Open | Durham Harold E | $78,400 |
Source: Public Records
Tax History Compared to Growth
Tax History
| Year | Tax Paid | Tax Assessment Tax Assessment Total Assessment is a certain percentage of the fair market value that is determined by local assessors to be the total taxable value of land and additions on the property. | Land | Improvement |
|---|---|---|---|---|
| 2025 | $291 | $212,488 | $60,000 | $176,870 |
| 2024 | $291 | $193,171 | $60,000 | $199,030 |
| 2023 | $2,137 | $231,690 | $60,000 | $171,690 |
| 2022 | $965 | $184,590 | $40,000 | $144,590 |
| 2021 | $2,228 | $145,140 | $20,000 | $125,140 |
| 2020 | $2,314 | $149,030 | $20,000 | $129,030 |
| 2019 | $2,220 | $146,970 | $20,000 | $126,970 |
| 2018 | $2,019 | $124,560 | $20,000 | $104,560 |
| 2017 | $1,888 | $112,880 | $20,000 | $92,880 |
| 2016 | $1,748 | $104,510 | $20,000 | $84,510 |
| 2015 | $1,092 | $102,350 | $20,000 | $82,350 |
| 2014 | $1,092 | $106,470 | $20,000 | $86,470 |
Source: Public Records
Map
Nearby Homes
- 704 Shady Grove Ct
- 3224 W Weems Ct
- 502 Shady Grove Dr
- 2231 Cobblestone Ct
- 210 Davis Rd
- 615 Whisperview Cir
- 157 Business Blvd
- 2009 Rock Dr
- 805 Branding Iron Trail
- 811 Branding Iron Trail
- 809 Branding Iron Trail
- Residence 3 Plan at The Residences at Cardinal Woods
- Residence 5 Plan at The Residences at Cardinal Woods
- Residence 4 Plan at The Residences at Cardinal Woods
- Residence 1 Plan at The Residences at Cardinal Woods
- Residence 2 Plan at The Residences at Cardinal Woods
- 807 Branding Iron Trail
- 2902 Davis Rd
- 1931 Hidden Valley Rd
- 3617 Fm-4 Tbd
- 3101 Shady Ln
- 3104 Shady Grove Cir
- 3103 Shady Ln
- 902 Shady Grove Dr
- 904 Shady Grove Dr
- 900 Shady Grove Dr
- 3101 Shady Grove Cir
- 3105 Shady Ln
- 3103 Shady Grove Cir
- 906 Shady Grove Dr
- 3106 Shady Grove Cir
- 812 Shady Grove Dr
- 908 Shady Grove Dr
- 3105 Shady Grove Cir
- 3107 Shady Ln
- 810 Shady Grove Dr
- 3107 Shady Grove Cir
- 809 Shady Grove Dr
- 3100 Shady Ln
- 3110 Shady Grove Cir