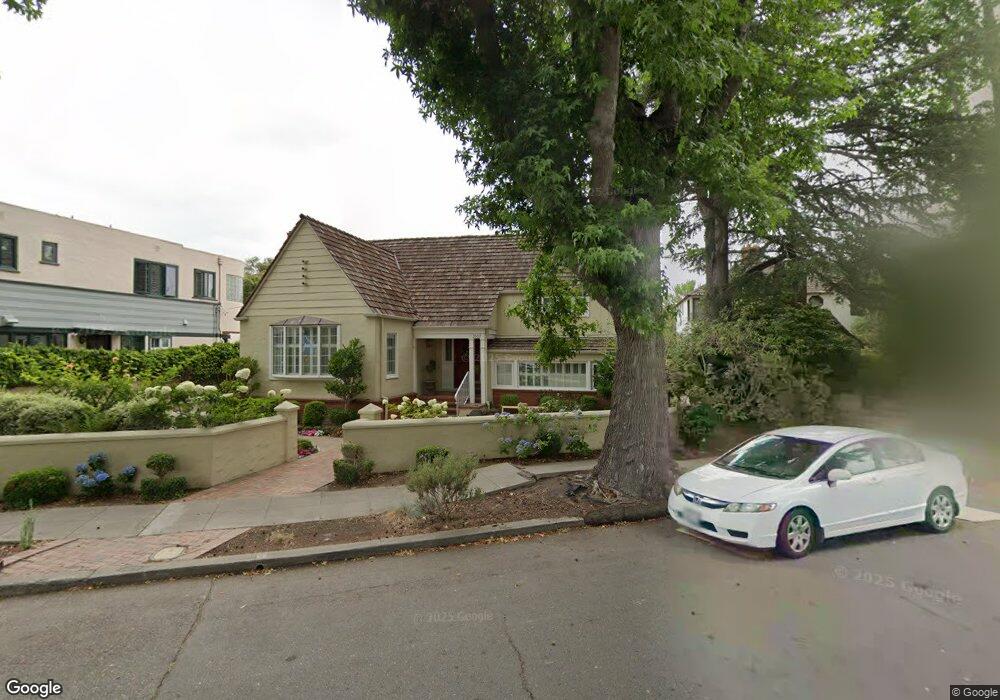
3107 Gibbons Dr Alameda, CA 94501
Downtown Alameda NeighborhoodEstimated Value: $1,494,000 - $1,924,000
3
Beds
2
Baths
2,131
Sq Ft
$767/Sq Ft
Est. Value
About This Home
This home is located at 3107 Gibbons Dr, Alameda, CA 94501 and is currently estimated at $1,635,512, approximately $767 per square foot. 3107 Gibbons Dr is a home located in Alameda County with nearby schools including Edison Elementary School, Lincoln Middle School, and Alameda High School.
Ownership History
Date
Name
Owned For
Owner Type
Purchase Details
Closed on
Feb 26, 2018
Sold by
Barde Robert Eric and Mckenzie Dawn Renee
Bought by
Barde Robert Eric and Mckenzie Dawn Renee
Current Estimated Value
Purchase Details
Closed on
May 19, 2017
Sold by
Santare Mark G and Santare Sue Ellen
Bought by
Barde Robert E and Mckenzie Dawn
Home Financials for this Owner
Home Financials are based on the most recent Mortgage that was taken out on this home.
Original Mortgage
$596,000
Outstanding Balance
$495,375
Interest Rate
4.08%
Mortgage Type
New Conventional
Estimated Equity
$1,140,137
Purchase Details
Closed on
Mar 2, 2012
Sold by
Santare Mark G and Santare Sue Ellen
Bought by
Santare Mark G and Santare Sue Ellen
Home Financials for this Owner
Home Financials are based on the most recent Mortgage that was taken out on this home.
Original Mortgage
$173,000
Interest Rate
3.92%
Mortgage Type
New Conventional
Purchase Details
Closed on
Jul 8, 2011
Sold by
Santare Mark G and Santare Sue Ellen
Bought by
Santare Mark G and Santare Sue Ellen
Home Financials for this Owner
Home Financials are based on the most recent Mortgage that was taken out on this home.
Original Mortgage
$174,400
Interest Rate
4.5%
Mortgage Type
New Conventional
Purchase Details
Closed on
Feb 23, 2010
Sold by
Santare Mark G and Santare Sue Ellen
Bought by
Santare Mark G and Santare Sue Ellen
Home Financials for this Owner
Home Financials are based on the most recent Mortgage that was taken out on this home.
Original Mortgage
$177,500
Interest Rate
4.97%
Mortgage Type
New Conventional
Purchase Details
Closed on
Apr 3, 2007
Sold by
Santare Mark G and Santare Sue Ellen
Bought by
Santare Mark G and Santare Sue Ellen
Home Financials for this Owner
Home Financials are based on the most recent Mortgage that was taken out on this home.
Original Mortgage
$184,000
Interest Rate
6.2%
Mortgage Type
New Conventional
Purchase Details
Closed on
Jan 28, 2003
Sold by
Santare Mark and Santare Sue Ellen
Bought by
Santare Mark G and Santare Sue Ellen
Purchase Details
Closed on
Oct 18, 2002
Sold by
Conte Shirley Ruth
Bought by
Santare Mark and Santare Sue Ellen
Home Financials for this Owner
Home Financials are based on the most recent Mortgage that was taken out on this home.
Original Mortgage
$445,000
Interest Rate
5.25%
Purchase Details
Closed on
May 11, 1995
Sold by
Conte Shirley
Bought by
Conte Shirley
Create a Home Valuation Report for This Property
The Home Valuation Report is an in-depth analysis detailing your home's value as well as a comparison with similar homes in the area
Home Values in the Area
Average Home Value in this Area
Purchase History
| Date | Buyer | Sale Price | Title Company |
|---|---|---|---|
| Barde Robert Eric | -- | None Available | |
| Barde Robert E | $1,496,000 | First American Title Company | |
| Santare Mark G | -- | Chicago Title Company | |
| Santare Mark G | -- | Chicago Title Company | |
| Santare Mark G | -- | Chicago Title Company | |
| Santare Mark G | -- | Chicago Title Company | |
| Santare Mark G | -- | Chicago Title Company | |
| Santare Mark G | -- | Chicago Title Company | |
| Santare Mark G | -- | None Available | |
| Santare Mark G | -- | Alliance Title Company | |
| Santare Mark G | -- | -- | |
| Santare Mark | $595,000 | First American Title Guarant | |
| Conte Shirley | -- | -- |
Source: Public Records
Mortgage History
| Date | Status | Borrower | Loan Amount |
|---|---|---|---|
| Open | Barde Robert E | $596,000 | |
| Previous Owner | Santare Mark G | $173,000 | |
| Previous Owner | Santare Mark G | $174,400 | |
| Previous Owner | Santare Mark G | $177,500 | |
| Previous Owner | Santare Mark G | $184,000 | |
| Previous Owner | Santare Mark | $445,000 |
Source: Public Records
Tax History Compared to Growth
Tax History
| Year | Tax Paid | Tax Assessment Tax Assessment Total Assessment is a certain percentage of the fair market value that is determined by local assessors to be the total taxable value of land and additions on the property. | Land | Improvement |
|---|---|---|---|---|
| 2025 | $7,633 | $429,950 | $152,338 | $284,612 |
| 2024 | $7,633 | $421,383 | $149,351 | $279,032 |
| 2023 | $7,374 | $419,985 | $146,423 | $273,562 |
| 2022 | $7,221 | $404,750 | $143,552 | $268,198 |
| 2021 | $7,064 | $396,678 | $140,738 | $262,940 |
| 2020 | $6,983 | $399,540 | $139,295 | $260,245 |
| 2019 | $6,310 | $391,707 | $136,564 | $255,143 |
| 2018 | $6,162 | $384,030 | $133,888 | $250,142 |
| 2017 | $9,365 | $742,481 | $222,744 | $519,737 |
| 2016 | $9,380 | $727,928 | $218,378 | $509,550 |
| 2015 | $9,347 | $716,998 | $215,099 | $501,899 |
| 2014 | $8,840 | $702,956 | $210,887 | $492,069 |
Source: Public Records
Map
Nearby Homes
- 2022 High St Unit A
- 1831 Harvard Dr
- 1818 Fremont Dr
- 3029 Thompson Ave
- 3114 Thompson Ave
- 3246 Garfield Ave
- 3103 Central Ave
- 1601 Broadway Unit 9
- 3957 Wattling St
- 2853 Regatta Dr Unit 179
- 1238 Versailles Ave
- 303 Bowsman Ct Unit 144
- 2620 Encinal Ave
- 340 29th Ave Unit 207
- 340 29th Ave Unit 204
- 2848 San Jose Ave
- 1259 Eastshore Dr
- 2310 Pacific Ave
- 1210 Broadway Unit A
- 2839 Washington St
- 3101 Gibbons Dr
- 3115 Gibbons Dr
- 1818 Cornell Dr
- 3119 Gibbons Dr
- 3104 Fernside Blvd
- 3108 Fernside Blvd
- 3112 Gibbons Dr
- 3108 Gibbons Dr
- 3100 Fernside Blvd
- 3110 Fernside Blvd
- 3116 Gibbons Dr
- 3104 Gibbons Dr
- 3114 Fernside Blvd
- 3120 Gibbons Dr
- 1811 Cornell Dr
- 3100 Gibbons Dr
- 1815 Cornell Dr
- 1807 Cornell Dr
- 3029 Gibbons Dr
- 1819 Cornell Dr