Estimated Value: $114,668 - $219,000
--
Bed
1
Bath
1,044
Sq Ft
$153/Sq Ft
Est. Value
About This Home
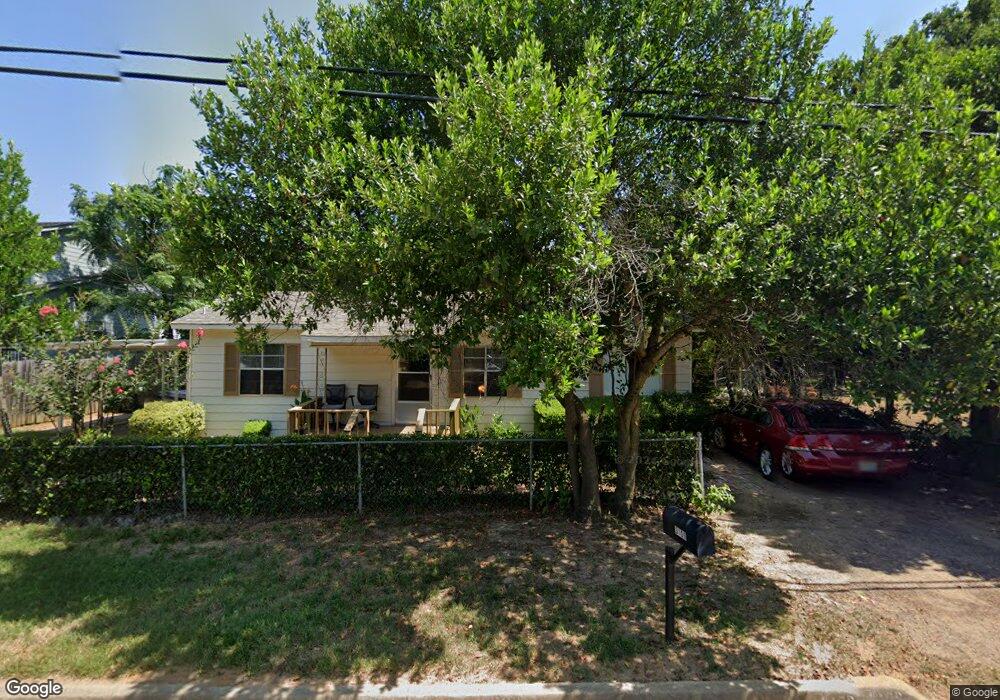
This home is located at 3109 Walton Rd, Tyler, TX 75701 and is currently estimated at $160,167, approximately $153 per square foot. 3109 Walton Rd is a home located in Smith County with nearby schools including Jones Elementary School, Three Lakes Middle School, and Tyler Legacy High School.
Ownership History
Date
Name
Owned For
Owner Type
Purchase Details
Closed on
Aug 9, 2017
Sold by
Weijia Properties Llc
Bought by
Howland Otis and Howland Doretha
Current Estimated Value
Home Financials for this Owner
Home Financials are based on the most recent Mortgage that was taken out on this home.
Original Mortgage
$62,000
Outstanding Balance
$51,372
Interest Rate
3.88%
Mortgage Type
Purchase Money Mortgage
Estimated Equity
$108,795
Purchase Details
Closed on
Aug 5, 2014
Sold by
Macarthur Shirley and Black Devon
Bought by
Su Weijia
Purchase Details
Closed on
Apr 1, 2009
Sold by
Bbb Ranch Construction Inc
Bought by
Macarthur Shirley and Black Devon
Home Financials for this Owner
Home Financials are based on the most recent Mortgage that was taken out on this home.
Original Mortgage
$66,250
Interest Rate
5.24%
Mortgage Type
Seller Take Back
Purchase Details
Closed on
May 20, 2008
Sold by
Stafford Shallonie
Bought by
Bbb Ranch Construction Inc
Create a Home Valuation Report for This Property
The Home Valuation Report is an in-depth analysis detailing your home's value as well as a comparison with similar homes in the area
Home Values in the Area
Average Home Value in this Area
Purchase History
| Date | Buyer | Sale Price | Title Company |
|---|---|---|---|
| Howland Otis | -- | None Available | |
| Su Weijia | $55,000 | None Available | |
| Macarthur Shirley | -- | None Available | |
| Macarthur Shirley | -- | None Available | |
| Bbb Ranch Construction Inc | -- | None Available |
Source: Public Records
Mortgage History
| Date | Status | Borrower | Loan Amount |
|---|---|---|---|
| Open | Howland Otis | $62,000 | |
| Previous Owner | Macarthur Shirley | $66,250 |
Source: Public Records
Tax History Compared to Growth
Tax History
| Year | Tax Paid | Tax Assessment Tax Assessment Total Assessment is a certain percentage of the fair market value that is determined by local assessors to be the total taxable value of land and additions on the property. | Land | Improvement |
|---|---|---|---|---|
| 2025 | $280 | $107,827 | $21,197 | $86,630 |
| 2024 | $280 | $66,102 | $2,100 | $109,366 |
| 2023 | $1,048 | $79,002 | $2,100 | $76,902 |
| 2022 | $1,070 | $72,922 | $2,100 | $70,822 |
| 2021 | $1,042 | $49,664 | $2,100 | $47,564 |
| 2020 | $968 | $45,658 | $2,100 | $43,558 |
| 2019 | $899 | $41,109 | $2,100 | $39,009 |
| 2018 | $870 | $39,997 | $2,100 | $37,897 |
| 2017 | $886 | $41,489 | $2,100 | $39,389 |
| 2016 | $886 | $41,489 | $2,100 | $39,389 |
| 2015 | $598 | $39,648 | $2,100 | $37,548 |
| 2014 | $598 | $38,578 | $2,100 | $36,478 |
Source: Public Records
Map
Nearby Homes
- 3209 Walton Rd
- 3018 Walton Rd
- 2712 Flint St
- 3010 Moorehead St
- 2711 Tol Ave
- 2322 Walton Rd
- 2940 Frankston Hwy
- 2986 Frankston Hwy
- 3004 Frankston Hwy
- 2950 Frankston Hwy
- 3008 Frankston Hwy
- 2954 Frankston Hwy
- 2928 Frankston Hwy
- 2934 Frankston Hwy
- 3016 Frankston Hwy
- 3012 Frankston Hwy
- 2319 Luther St
- 2922 Frankston Hwy
- 2801 Wexford Dr Unit 1401
- 2801 Wexford Dr
- 2723 Flint St
- 3115 Walton Rd
- 3114 3114 Waton Rd
- 3027 Walton Rd
- 3114 Walton Rd
- 3118 Walton Rd
- 3110 Walton Rd
- 3122 Walton Rd
- 3106 Walton Rd
- 3021 Walton Rd
- 3019 Walton Rd
- 3206 Walton Rd
- 2724 Flint St
- 3115 Moorhead St
- 3111 Moorhead St
- 3103 Moorhead St
- 3123 Moorhead St
- 3017 Walton Rd
- 2802 Oliver St
- 3107 Moorhead St