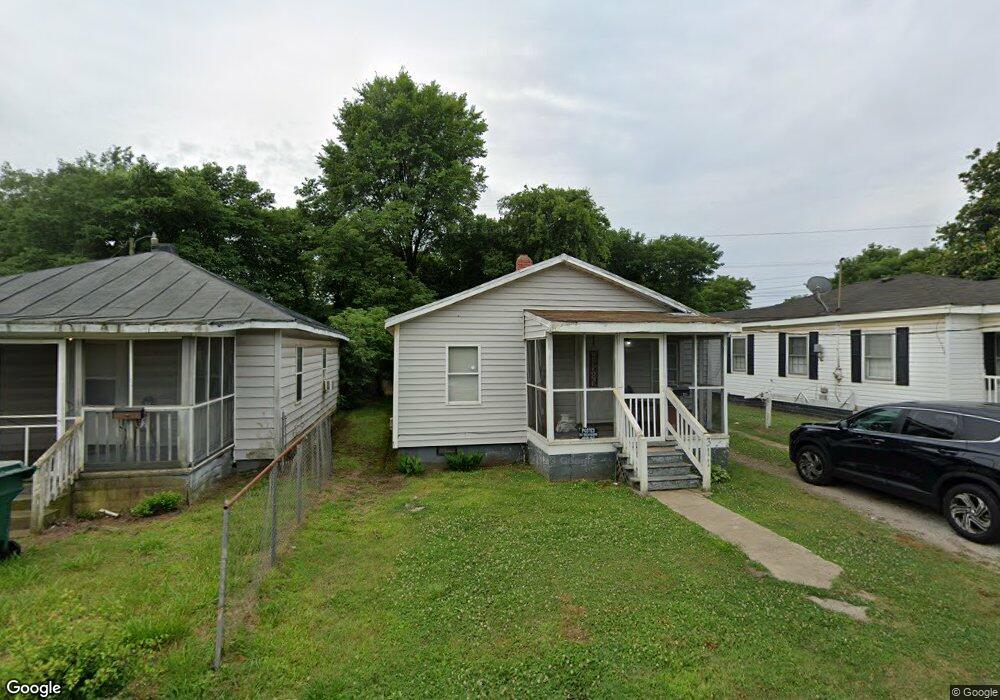
311 Duke St Suffolk, VA 23434
Holy Neck NeighborhoodEstimated Value: $66,000 - $117,673
2
Beds
1
Bath
822
Sq Ft
$98/Sq Ft
Est. Value
About This Home
This home is located at 311 Duke St, Suffolk, VA 23434 and is currently estimated at $80,918, approximately $98 per square foot. 311 Duke St is a home located in Suffolk City with nearby schools including Booker T. Washington Elementary School, King's Fork Middle School, and Lakeland High School.
Ownership History
Date
Name
Owned For
Owner Type
Purchase Details
Closed on
May 30, 2025
Sold by
Hill Claudia A
Bought by
Nve Rehab Llc
Current Estimated Value
Home Financials for this Owner
Home Financials are based on the most recent Mortgage that was taken out on this home.
Original Mortgage
$80,000
Outstanding Balance
$46,051
Interest Rate
5.92%
Mortgage Type
Construction
Estimated Equity
$34,867
Purchase Details
Closed on
Nov 6, 2023
Sold by
Lee George and Hill Claudia A
Bought by
Hill Claudia A
Create a Home Valuation Report for This Property
The Home Valuation Report is an in-depth analysis detailing your home's value as well as a comparison with similar homes in the area
Home Values in the Area
Average Home Value in this Area
Purchase History
| Date | Buyer | Sale Price | Title Company |
|---|---|---|---|
| Nve Rehab Llc | $70,000 | First American Title | |
| Hill Claudia A | -- | None Listed On Document |
Source: Public Records
Mortgage History
| Date | Status | Borrower | Loan Amount |
|---|---|---|---|
| Open | Nve Rehab Llc | $80,000 |
Source: Public Records
Tax History Compared to Growth
Tax History
| Year | Tax Paid | Tax Assessment Tax Assessment Total Assessment is a certain percentage of the fair market value that is determined by local assessors to be the total taxable value of land and additions on the property. | Land | Improvement |
|---|---|---|---|---|
| 2024 | $1,404 | $86,900 | $41,200 | $45,700 |
| 2023 | $1,323 | $82,700 | $39,300 | $43,400 |
| 2022 | $701 | $64,300 | $28,000 | $36,300 |
| 2021 | $652 | $58,700 | $22,400 | $36,300 |
| 2020 | $595 | $53,600 | $20,400 | $33,200 |
| 2019 | $595 | $53,600 | $20,400 | $33,200 |
| 2018 | $725 | $53,400 | $20,400 | $33,000 |
| 2017 | $571 | $53,400 | $20,400 | $33,000 |
| 2016 | $571 | $53,400 | $20,400 | $33,000 |
| 2015 | $418 | $54,900 | $20,400 | $34,500 |
| 2014 | $418 | $54,900 | $20,400 | $34,500 |
Source: Public Records
Map
Nearby Homes