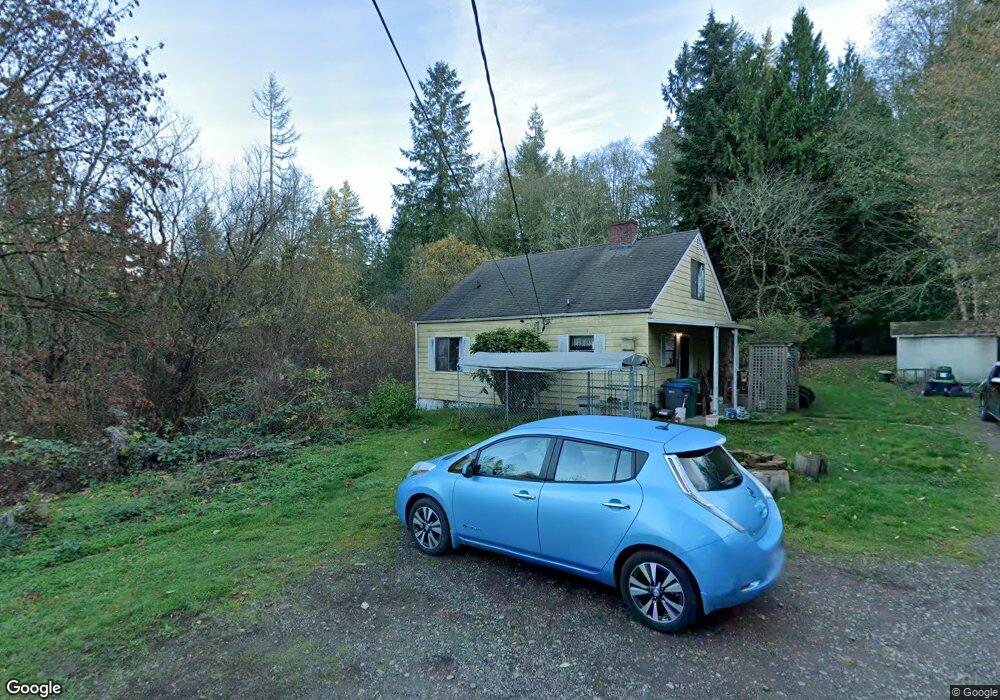
311 NE Waaga Way Bremerton, WA 98311
Estimated Value: $450,256 - $558,000
3
Beds
2
Baths
1,472
Sq Ft
$350/Sq Ft
Est. Value
About This Home
This home is located at 311 NE Waaga Way, Bremerton, WA 98311 and is currently estimated at $514,564, approximately $349 per square foot. 311 NE Waaga Way is a home located in Kitsap County with nearby schools including Cottonwood Elementary School, Fairview Middle School, and Olympic High School.
Ownership History
Date
Name
Owned For
Owner Type
Purchase Details
Closed on
Aug 15, 2019
Sold by
Johnsen Shihea A
Bought by
Johnsen Shihea A
Current Estimated Value
Home Financials for this Owner
Home Financials are based on the most recent Mortgage that was taken out on this home.
Original Mortgage
$279,519
Outstanding Balance
$245,058
Interest Rate
3.75%
Mortgage Type
FHA
Estimated Equity
$269,506
Purchase Details
Closed on
Sep 12, 2018
Sold by
Johnsen Jeffery Scott and Johnsen Shihea A
Bought by
Johnsen Shihea A
Home Financials for this Owner
Home Financials are based on the most recent Mortgage that was taken out on this home.
Original Mortgage
$279,532
Interest Rate
4.37%
Mortgage Type
FHA
Purchase Details
Closed on
Aug 12, 2011
Sold by
Johnsen Harry L
Bought by
Johnsen Jeffery S and Johnsen Shihea A
Create a Home Valuation Report for This Property
The Home Valuation Report is an in-depth analysis detailing your home's value as well as a comparison with similar homes in the area
Home Values in the Area
Average Home Value in this Area
Purchase History
| Date | Buyer | Sale Price | Title Company |
|---|---|---|---|
| Johnsen Shihea A | -- | Amrock | |
| Johnsen Shihea A | -- | Attorneys Title Of Kitsap Po | |
| Johnsen Jeffery S | $220,280 | None Available |
Source: Public Records
Mortgage History
| Date | Status | Borrower | Loan Amount |
|---|---|---|---|
| Open | Johnsen Shihea A | $279,519 | |
| Closed | Johnsen Shihea A | $279,532 |
Source: Public Records
Tax History Compared to Growth
Tax History
| Year | Tax Paid | Tax Assessment Tax Assessment Total Assessment is a certain percentage of the fair market value that is determined by local assessors to be the total taxable value of land and additions on the property. | Land | Improvement |
|---|---|---|---|---|
| 2026 | $3,346 | $350,410 | $187,920 | $162,490 |
| 2025 | $3,346 | $350,410 | $187,920 | $162,490 |
| 2024 | $3,255 | $350,410 | $187,920 | $162,490 |
| 2023 | $3,266 | $350,410 | $187,920 | $162,490 |
| 2022 | $3,074 | $290,290 | $155,300 | $134,990 |
| 2021 | $3,510 | $317,520 | $149,150 | $168,370 |
| 2020 | $3,279 | $299,950 | $140,740 | $159,210 |
| 2019 | $3,060 | $270,720 | $127,090 | $143,630 |
| 2018 | $3,278 | $224,830 | $105,030 | $119,800 |
| 2017 | $2,910 | $224,830 | $105,030 | $119,800 |
| 2016 | $2,976 | $212,900 | $105,020 | $107,880 |
| 2015 | $2,858 | $213,390 | $116,350 | $97,040 |
| 2014 | -- | $207,150 | $116,350 | $90,800 |
| 2013 | -- | $207,150 | $116,350 | $90,800 |
Source: Public Records
Map
Nearby Homes
- 305 NE Waaga Way
- 481 NE Waaga Way
- 10155 Royal Valley Rd NE
- 965 NE Milton Ct
- 241 NE Watson Ct
- 9406 Saint Johns Place NE
- 563 NW Silver Glen Ln
- 9346 Nels Nelson Rd NW
- 8811 Overlook Circle Dr NE Unit 71
- 679 NE Conifer Dr
- 981 Mahogany Ln NW
- 910 NW Leisure Ln
- 250 NE Silver Pine Dr
- 9672 Long Point Ln NW
- 8537 Washington 303
- 9155 Kristi Ct NW
- 1135 NW Windy Beach Ln
- 8760 Washington 303 Unit L
- 8640 Washington 303
- 9656 Sandy Isle Ln NW
- 325 NE Waaga Way
- 135 NE Waaga Way
- 359 NE Waaga Way
- 9450 Central Valley Rd NE
- 1 Hwy 303
- 1 Washington 303
- 9348 Fairhaven Cir NE
- 9591 Fairhaven Cir NE
- 541 NE Ormsby Way
- 9384 Fairhaven Cir NE
- 9396 Fairhaven Cir NE
- 9491 Fairhaven Cir NE
- 9527 Fairhaven Cir NE
- 8949 Watson Place NE
- 8951 Watson Place NE
- 9408 Fairhaven Cir NE
- 553 NE Ormsby Way
- 9577 Fairhaven Cir NE
- 88888 Cantershire Ave NE
- 99999 Cantershire Ave NE