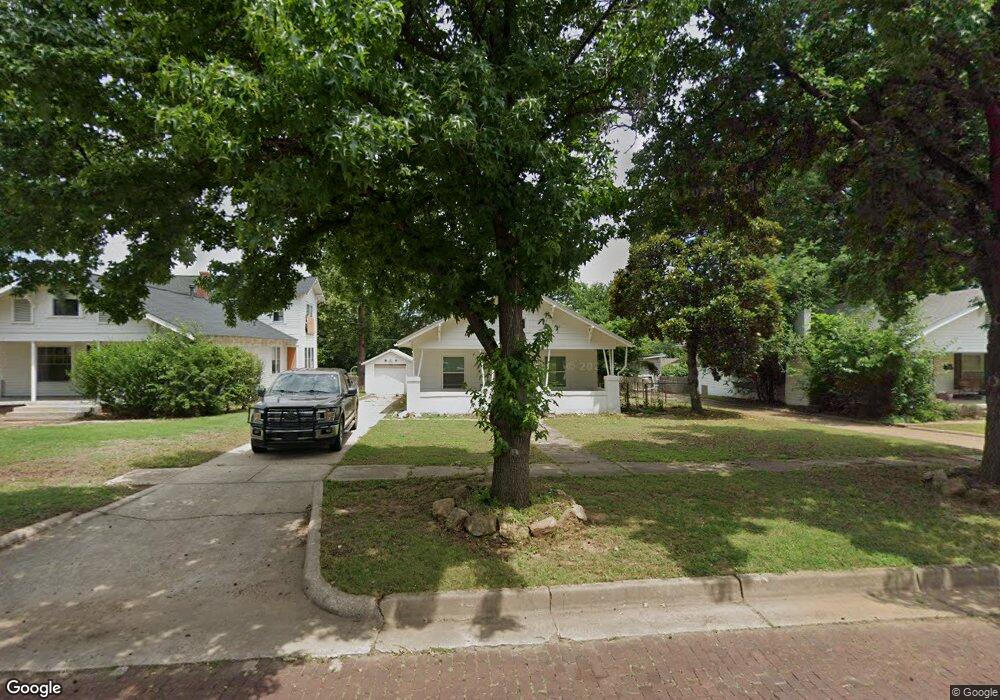
311 S 8th St Ponca City, OK 74601
Estimated Value: $78,000 - $102,000
2
Beds
2
Baths
1,232
Sq Ft
$71/Sq Ft
Est. Value
About This Home
This home is located at 311 S 8th St, Ponca City, OK 74601 and is currently estimated at $87,452, approximately $70 per square foot. 311 S 8th St is a home located in Kay County with nearby schools including Garfield Elementary School, Ponca City East Middle School, and Ponca City West Middle School.
Ownership History
Date
Name
Owned For
Owner Type
Purchase Details
Closed on
Jun 25, 2024
Sold by
Caballero Belen and Caballero Jovan
Bought by
Mccoy Timothy and Mccoy Deborah
Current Estimated Value
Purchase Details
Closed on
Jul 19, 2021
Sold by
Secretary Of Housing & Urban Development
Bought by
Caballero Jovan
Home Financials for this Owner
Home Financials are based on the most recent Mortgage that was taken out on this home.
Original Mortgage
$27,000
Interest Rate
2.96%
Mortgage Type
Purchase Money Mortgage
Purchase Details
Closed on
Apr 24, 2007
Sold by
Waymire Dan R and Waymire Mary Anne
Bought by
Griffith Todd
Home Financials for this Owner
Home Financials are based on the most recent Mortgage that was taken out on this home.
Original Mortgage
$59,529
Interest Rate
6.1%
Mortgage Type
FHA
Purchase Details
Closed on
Dec 14, 2000
Sold by
Loren Mock Family Rev Tr
Bought by
Waymire Dan and Waymire Mary A
Create a Home Valuation Report for This Property
The Home Valuation Report is an in-depth analysis detailing your home's value as well as a comparison with similar homes in the area
Home Values in the Area
Average Home Value in this Area
Purchase History
| Date | Buyer | Sale Price | Title Company |
|---|---|---|---|
| Mccoy Timothy | $85,000 | None Listed On Document | |
| Caballero Jovan | -- | None Available | |
| Griffith Todd | $60,000 | -- | |
| Waymire Dan | $42,000 | -- |
Source: Public Records
Mortgage History
| Date | Status | Borrower | Loan Amount |
|---|---|---|---|
| Previous Owner | Caballero Jovan | $27,000 | |
| Previous Owner | Griffith Todd | $59,529 |
Source: Public Records
Tax History Compared to Growth
Tax History
| Year | Tax Paid | Tax Assessment Tax Assessment Total Assessment is a certain percentage of the fair market value that is determined by local assessors to be the total taxable value of land and additions on the property. | Land | Improvement |
|---|---|---|---|---|
| 2024 | $592 | $6,253 | $554 | $5,699 |
| 2023 | $592 | $5,956 | $554 | $5,402 |
| 2022 | $540 | $5,672 | $554 | $5,118 |
| 2021 | $543 | $5,672 | $554 | $5,118 |
| 2020 | $537 | $5,672 | $554 | $5,118 |
| 2019 | $526 | $5,506 | $554 | $4,952 |
| 2018 | $543 | $5,608 | $554 | $5,054 |
| 2017 | $550 | $5,608 | $554 | $5,054 |
| 2016 | $565 | $5,710 | $554 | $5,156 |
| 2015 | $558 | $5,610 | $554 | $5,056 |
| 2014 | $553 | $5,666 | $554 | $5,112 |
Source: Public Records
Map
Nearby Homes
- 310 S 9th St
- 701 S 8th St
- 202 N 7th St
- 213 N 10th St
- 408 S 4th St
- 216 N 12th St Unit 840
- 310 N 7th St Unit 660
- 800 S 12th St
- 212 E Ponca Ave
- 417 S 2nd St
- 1001 S 9th St
- 409 N 5th St
- 1020 S 8th St
- 815 E Madison Ave
- 1103 S 6th St
- 410 Drake Dr
- 417 N 3rd St
- 4025 S Union St
- 1220 S 8th St Unit 480
- 1218 S 6th St