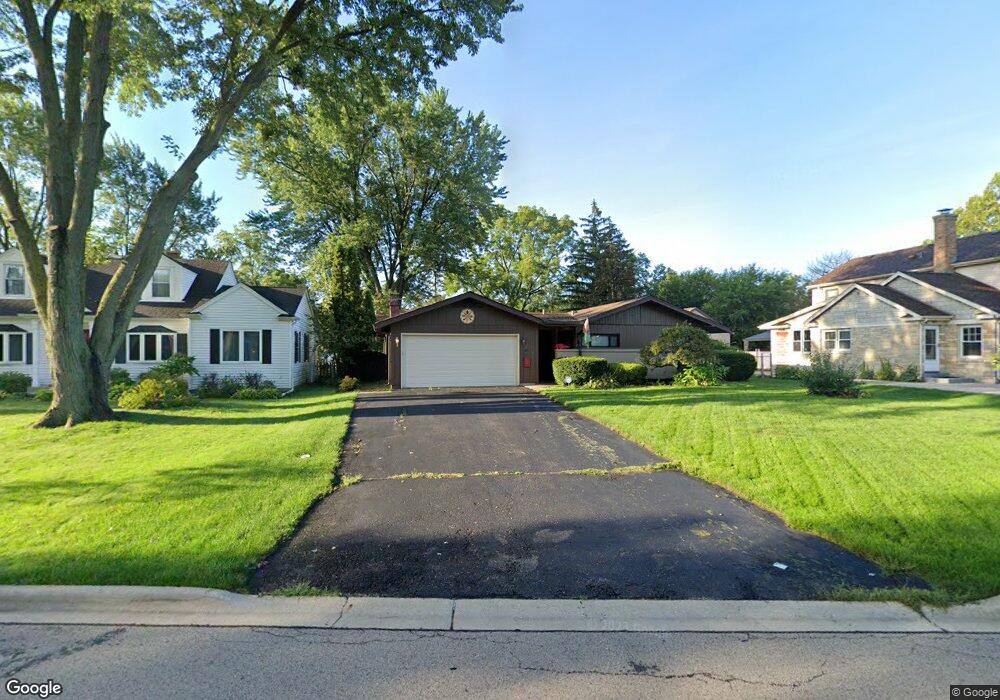
311 W Potomac Ave Lombard, IL 60148
North Lombard NeighborhoodEstimated Value: $446,191 - $511,000
4
Beds
--
Bath
1,924
Sq Ft
$249/Sq Ft
Est. Value
About This Home
This home is located at 311 W Potomac Ave, Lombard, IL 60148 and is currently estimated at $478,548, approximately $248 per square foot. 311 W Potomac Ave is a home located in DuPage County with nearby schools including Park View Elementary School, Pleasant Lane Elementary School, and Madison Elementary School.
Ownership History
Date
Name
Owned For
Owner Type
Purchase Details
Closed on
Apr 16, 2024
Sold by
Mason Rosanne M and Mark R Shutock Living Trust
Bought by
Shutock Mark R and Shutock Rosanne M
Current Estimated Value
Purchase Details
Closed on
Jul 11, 2018
Sold by
Shutock Mark R and Shutock Laura J
Bought by
Shutock Mark R and Mark R Shutock Living Trust
Purchase Details
Closed on
Jun 29, 2004
Sold by
Francis Carl M and Francis Kathleen S
Bought by
Shutock Mark R and Shutock Laura J
Home Financials for this Owner
Home Financials are based on the most recent Mortgage that was taken out on this home.
Original Mortgage
$210,000
Interest Rate
6.4%
Mortgage Type
Purchase Money Mortgage
Purchase Details
Closed on
Jan 13, 2004
Sold by
Francis Kathleen S and Living Trust Agreement Joan Fr
Bought by
Francis Kathleen S and Francis Carl M
Purchase Details
Closed on
Oct 21, 1993
Sold by
Francis William E and Francis Joan
Bought by
Francis William E and William E Francis Living Trust
Create a Home Valuation Report for This Property
The Home Valuation Report is an in-depth analysis detailing your home's value as well as a comparison with similar homes in the area
Home Values in the Area
Average Home Value in this Area
Purchase History
| Date | Buyer | Sale Price | Title Company |
|---|---|---|---|
| Shutock Mark R | -- | None Listed On Document | |
| Shutock Mark R | -- | Attorney | |
| Shutock Mark R | $327,000 | Burnet Title Llc | |
| Francis Kathleen S | -- | Chicago Title Insurance Comp | |
| Francis Kathleen S | -- | Chicago Title Insurance Comp | |
| Francis William E | -- | -- |
Source: Public Records
Mortgage History
| Date | Status | Borrower | Loan Amount |
|---|---|---|---|
| Previous Owner | Shutock Mark R | $210,000 |
Source: Public Records
Tax History Compared to Growth
Tax History
| Year | Tax Paid | Tax Assessment Tax Assessment Total Assessment is a certain percentage of the fair market value that is determined by local assessors to be the total taxable value of land and additions on the property. | Land | Improvement |
|---|---|---|---|---|
| 2024 | $9,982 | $136,473 | $33,480 | $102,993 |
| 2023 | $9,505 | $126,200 | $30,960 | $95,240 |
| 2022 | $9,201 | $121,310 | $29,760 | $91,550 |
| 2021 | $8,915 | $118,290 | $29,020 | $89,270 |
| 2020 | $8,729 | $115,690 | $28,380 | $87,310 |
| 2019 | $8,296 | $109,990 | $26,980 | $83,010 |
| 2018 | $7,732 | $99,160 | $24,320 | $74,840 |
| 2017 | $8,769 | $109,250 | $33,350 | $75,900 |
| 2016 | $8,537 | $102,920 | $31,420 | $71,500 |
| 2015 | $8,075 | $95,880 | $29,270 | $66,610 |
| 2014 | $8,763 | $100,700 | $35,720 | $64,980 |
| 2013 | $8,627 | $102,120 | $36,220 | $65,900 |
Source: Public Records
Map
Nearby Homes
- 333 W Potomac Ave
- 306 W Sunset Ave
- 229 W Berkshire Ave
- 201 W Potomac Ave
- 333 W Goebel Dr
- 201 W Crystal Ave
- 140 W Sunset Ave
- 124 W Sunset Ave
- 600 W Pleasant Ln Unit A2
- 147 W North Ave
- 22 N Columbine Ave
- 546 N Main St
- 21W065 Sunset Ave
- 230 Troy Ln
- 206 Troy Ln
- 506 N Garfield St
- 251 Cimarron Rd E
- 260 N Charlotte St
- 78 N Elizabeth St
- 231 E Berkshire Ave
- 321 W Potomac Ave
- 309 W Potomac Ave
- 307 W Potomac Ave
- 327 W Potomac Ave
- 303 W Potomac Ave
- 520 N Elizabeth St
- 312 W Potomac Ave
- 328 W Potomac Ave
- 308 W Potomac Ave
- 510 N Elizabeth St
- 339 W Potomac Ave
- 320 W Potomac Ave
- 330 W Potomac Ave
- 502 N Elizabeth St
- 302 W Potomac Ave
- 249 W Potomac Ave
- 470 N Elizabeth St
- 334 W Potomac Ave
- 242 W Berkshire Ave
- 503 N West Rd