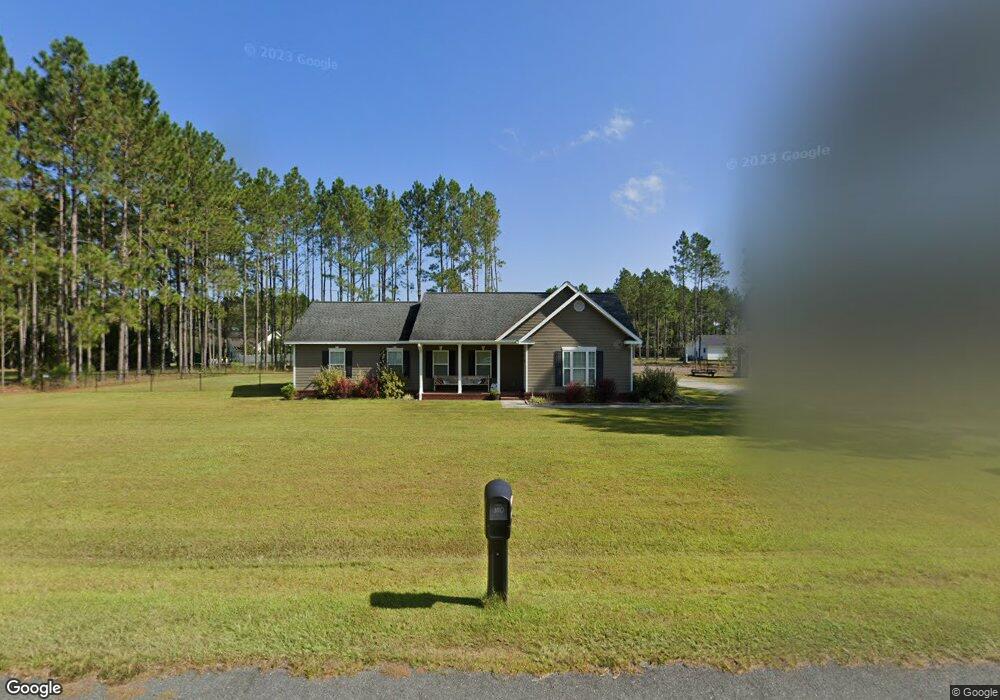
3110 Duward St Patterson, GA 31557
Estimated Value: $255,241 - $309,000
3
Beds
2
Baths
1,686
Sq Ft
$170/Sq Ft
Est. Value
About This Home
This home is located at 3110 Duward St, Patterson, GA 31557 and is currently estimated at $286,060, approximately $169 per square foot. 3110 Duward St is a home with nearby schools including Pierce County High School and Southeast Christian Academy.
Ownership History
Date
Name
Owned For
Owner Type
Purchase Details
Closed on
Jun 3, 2022
Sold by
Griffis John H
Bought by
Britt John Kevin and Britt Brandi Leigh
Current Estimated Value
Home Financials for this Owner
Home Financials are based on the most recent Mortgage that was taken out on this home.
Original Mortgage
$10,000,000
Outstanding Balance
$3,280,566
Interest Rate
5.27%
Mortgage Type
New Conventional
Estimated Equity
-$2,994,506
Purchase Details
Closed on
Nov 5, 2018
Sold by
Herndon Glenda
Bought by
Griffis John H and Griffis Carolann
Home Financials for this Owner
Home Financials are based on the most recent Mortgage that was taken out on this home.
Original Mortgage
$151,515
Interest Rate
4.7%
Mortgage Type
New Conventional
Purchase Details
Closed on
Jul 6, 2011
Sold by
Barnard J P
Bought by
Herndon Glenda
Purchase Details
Closed on
May 17, 2001
Sold by
Deal Ben J and Deal Amelia D
Bought by
Drawdy Barnard J and Drawdy Edward
Create a Home Valuation Report for This Property
The Home Valuation Report is an in-depth analysis detailing your home's value as well as a comparison with similar homes in the area
Home Values in the Area
Average Home Value in this Area
Purchase History
| Date | Buyer | Sale Price | Title Company |
|---|---|---|---|
| Britt John Kevin | $230,000 | -- | |
| Griffis John H | $150,000 | -- | |
| Herndon Glenda | $8,500 | -- | |
| Drawdy Barnard J | $290,000 | -- |
Source: Public Records
Mortgage History
| Date | Status | Borrower | Loan Amount |
|---|---|---|---|
| Open | Britt John Kevin | $10,000,000 | |
| Previous Owner | Griffis John H | $151,515 |
Source: Public Records
Tax History Compared to Growth
Tax History
| Year | Tax Paid | Tax Assessment Tax Assessment Total Assessment is a certain percentage of the fair market value that is determined by local assessors to be the total taxable value of land and additions on the property. | Land | Improvement |
|---|---|---|---|---|
| 2025 | $2,041 | $89,359 | $3,800 | $85,559 |
| 2024 | $2,041 | $87,125 | $3,800 | $83,325 |
| 2023 | $1,994 | $85,108 | $3,800 | $81,308 |
| 2022 | $1,638 | $60,627 | $3,400 | $57,227 |
| 2021 | $1,544 | $58,253 | $3,400 | $54,853 |
| 2020 | $1,504 | $55,879 | $3,400 | $52,479 |
| 2019 | $1,515 | $55,879 | $3,400 | $52,479 |
| 2018 | $1,297 | $51,343 | $3,400 | $47,943 |
| 2017 | $1,367 | $49,748 | $3,400 | $46,348 |
| 2016 | $1,302 | $49,748 | $3,400 | $46,348 |
| 2015 | $91 | $49,747 | $3,400 | $46,348 |
| 2014 | $91 | $49,748 | $3,400 | $46,348 |
| 2013 | $91 | $49,747 | $3,400 | $46,347 |
Source: Public Records
Map
Nearby Homes
- 5612 Hickory Dr
- 5518 W Railroad Ave
- 5525 E Railroad Ave
- 3532 Dallas St
- 3548 Williams St
- 6034 E Main St
- 5947 Reese St
- 3881 Cut Path Rd
- 6162 Griner Rd
- 0 Ga Hwy 32
- 2114 Mill Creek Rd
- 2460 Thornton Rd
- 3675 Troy Rd
- 5466 Robin Rd
- 6005 Chancey Rd
- 5466 Robbin Rd
- 4725 Otter Creek Cir
- 4720 Otter Creek Cir
- 4750 Otter Creek Cir
- 4159 Folks Dr
- 3108 Duward St
- 3112 Duward St
- 3107 Duward Rd
- 3105 Duward Rd
- 000 Duward Rd
- 3129 Rhett Cir
- 3125 Rhett Cir
- 3106 Duward St
- 3114 Duward St
- 3103 Duward Rd
- 3111 Duward Rd
- 3122 Rhett Cir
- 3116 Duward St
- 3133 Rhett Cir
- 3118 Rhett Cir
- 3113 Duward St
- 3101 Duward St
- 5574 Walkerville Rd
- 3116 Rhett Cir
- 5555 Walkerville Rd