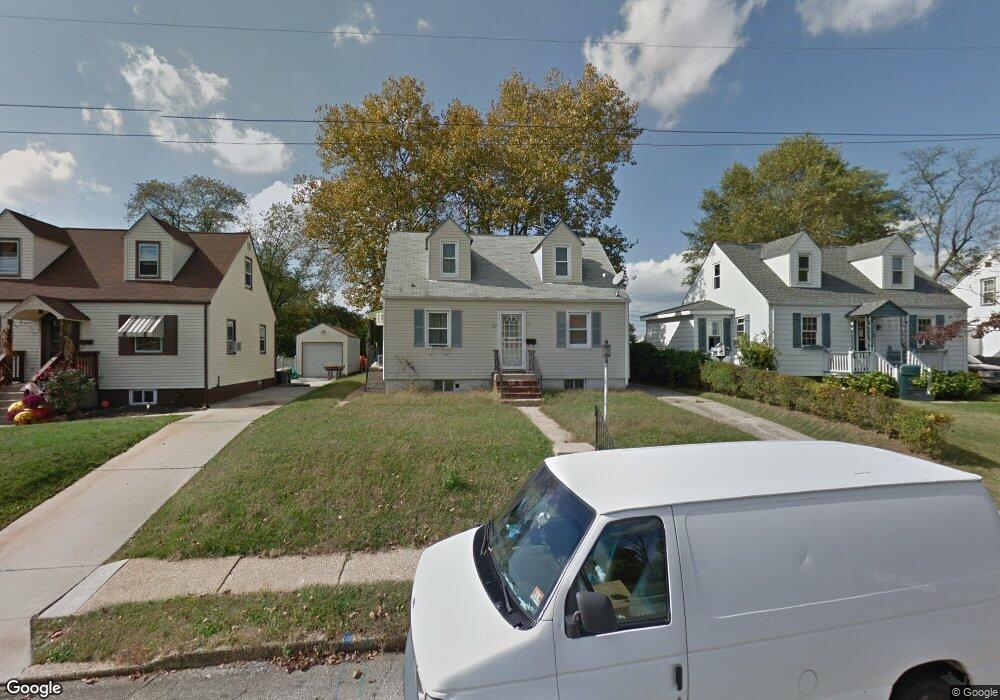
312 Greenwich Ave Paulsboro, NJ 08066
Estimated Value: $171,865 - $287,000
--
Bed
--
Bath
1,152
Sq Ft
$207/Sq Ft
Est. Value
About This Home
This home is located at 312 Greenwich Ave, Paulsboro, NJ 08066 and is currently estimated at $238,966, approximately $207 per square foot. 312 Greenwich Ave is a home located in Gloucester County with nearby schools including Billingsport Elementary School, Loudenslager Elementary School, and Paulsboro High School.
Ownership History
Date
Name
Owned For
Owner Type
Purchase Details
Closed on
Sep 8, 1997
Sold by
Lorac Management Corp
Bought by
Rivera Luis A and Rivera Sandra Y
Current Estimated Value
Home Financials for this Owner
Home Financials are based on the most recent Mortgage that was taken out on this home.
Original Mortgage
$84,765
Outstanding Balance
$13,009
Interest Rate
7.36%
Mortgage Type
FHA
Estimated Equity
$225,957
Purchase Details
Closed on
May 27, 1997
Sold by
Hud
Bought by
Lorac Management Corp
Purchase Details
Closed on
Oct 30, 1996
Sold by
Gill Charles W
Bought by
Hud
Home Financials for this Owner
Home Financials are based on the most recent Mortgage that was taken out on this home.
Original Mortgage
$76,920
Interest Rate
7.5%
Create a Home Valuation Report for This Property
The Home Valuation Report is an in-depth analysis detailing your home's value as well as a comparison with similar homes in the area
Home Values in the Area
Average Home Value in this Area
Purchase History
| Date | Buyer | Sale Price | Title Company |
|---|---|---|---|
| Rivera Luis A | $84,900 | Fidelity Title Abstract Co | |
| Lorac Management Corp | $46,500 | Surety Title Corporation | |
| Hud | -- | -- |
Source: Public Records
Mortgage History
| Date | Status | Borrower | Loan Amount |
|---|---|---|---|
| Open | Rivera Luis A | $84,765 | |
| Previous Owner | Hud | $76,920 |
Source: Public Records
Tax History Compared to Growth
Tax History
| Year | Tax Paid | Tax Assessment Tax Assessment Total Assessment is a certain percentage of the fair market value that is determined by local assessors to be the total taxable value of land and additions on the property. | Land | Improvement |
|---|---|---|---|---|
| 2025 | $4,444 | $101,000 | $28,900 | $72,100 |
| 2024 | $4,440 | $101,000 | $28,900 | $72,100 |
| 2023 | $4,440 | $101,000 | $28,900 | $72,100 |
| 2022 | $4,359 | $101,000 | $28,900 | $72,100 |
| 2021 | $4,274 | $101,000 | $28,900 | $72,100 |
| 2020 | $4,248 | $101,000 | $28,900 | $72,100 |
| 2019 | $4,115 | $101,000 | $28,900 | $72,100 |
| 2018 | $3,879 | $101,000 | $28,900 | $72,100 |
| 2017 | $3,863 | $101,000 | $28,900 | $72,100 |
| 2016 | $3,680 | $101,000 | $28,900 | $72,100 |
| 2015 | $3,659 | $101,000 | $28,900 | $72,100 |
| 2014 | $3,924 | $116,500 | $25,900 | $90,600 |
Source: Public Records
Map
Nearby Homes
- 400 Billings Ave
- 279 Lincoln Ave
- 334 Lincoln Ave
- 300 Lincoln Ave
- 423 Sheridan Ave
- 242 Billingsport Rd
- 424 Sheridan Ave
- 521 N Delaware St
- 546 Billings Ave
- 591 N Delaware St Unit M10
- 53 Capitol St
- 53-55 Roosevelt St
- 46 Roosevelt St
- 212 E Jefferson St
- 27 29 E Adams St
- 106 E Adams St
- 28 E Adams St
- 28 W Jefferson St
- 140 142 W Jefferson St
- 21 W Adams St
- 308 Greenwich Ave
- 316 Greenwich Ave
- 320 Greenwich Ave
- 317 Nassau Ave
- 324 Greenwich Ave
- 300 Greenwich Ave
- 309 Nassau Ave Unit 313
- 317 Greenwich Ave
- 325 Nassau Ave
- 328 Greenwich Ave
- 301 Nassau Ave
- 325 Greenwich Ave
- 329 Nassau Ave
- 329 Greenwich Ave
- 301 Greenwich Ave
- 332 Greenwich Ave
- 260 Greenwich Ave Unit 262
- 265 Nassau Ave
- 333 Nassau Ave
- 262 Greenwich Ave