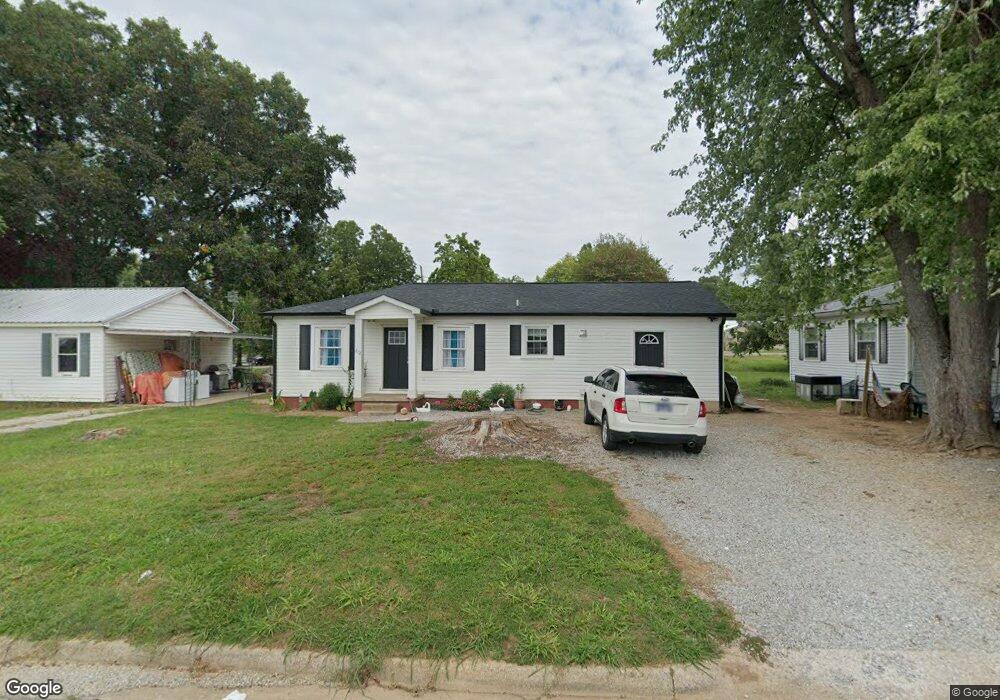
312 Johnson St Lawrenceburg, TN 38464
Estimated Value: $109,429 - $175,000
--
Bed
1
Bath
850
Sq Ft
$175/Sq Ft
Est. Value
About This Home
This home is located at 312 Johnson St, Lawrenceburg, TN 38464 and is currently estimated at $148,607, approximately $174 per square foot. 312 Johnson St is a home located in Lawrence County with nearby schools including Ingram Sowell Elementary School, David Crockett Elementary School, and Lawrenceburg Public Elementary School.
Ownership History
Date
Name
Owned For
Owner Type
Purchase Details
Closed on
Dec 19, 2019
Sold by
Kelley Alan and Kelley Larry
Bought by
Contreras Oswaldo Antonio Duante
Current Estimated Value
Purchase Details
Closed on
Oct 23, 2019
Sold by
Kelley Randy and Kelley Alan
Bought by
Kelley Alan and Kelley Larry
Purchase Details
Closed on
Oct 22, 2019
Sold by
Kelly John
Bought by
Kelley Alan and Kelley Larry
Purchase Details
Closed on
Aug 31, 1994
Sold by
Fleenor James F
Bought by
Kelley Kelley R and Kelley Marie J
Purchase Details
Closed on
Oct 11, 1991
Bought by
Fleenor James Fred
Purchase Details
Closed on
Jan 1, 1983
Bought by
Whitlock Carol Jean
Create a Home Valuation Report for This Property
The Home Valuation Report is an in-depth analysis detailing your home's value as well as a comparison with similar homes in the area
Home Values in the Area
Average Home Value in this Area
Purchase History
| Date | Buyer | Sale Price | Title Company |
|---|---|---|---|
| Contreras Oswaldo Antonio Duante | $7,000 | None Available | |
| Kelley Alan | -- | None Available | |
| Kelley Alan | -- | None Available | |
| Kelley Kelley R | $18,000 | -- | |
| Fleenor James Fred | $12,000 | -- | |
| Whitlock Carol Jean | $4,000 | -- |
Source: Public Records
Tax History Compared to Growth
Tax History
| Year | Tax Paid | Tax Assessment Tax Assessment Total Assessment is a certain percentage of the fair market value that is determined by local assessors to be the total taxable value of land and additions on the property. | Land | Improvement |
|---|---|---|---|---|
| 2025 | $543 | $17,450 | $0 | $0 |
| 2024 | $543 | $17,450 | $2,500 | $14,950 |
| 2023 | $543 | $17,450 | $2,500 | $14,950 |
| 2022 | $543 | $17,450 | $2,500 | $14,950 |
| 2021 | $340 | $7,725 | $2,000 | $5,725 |
| 2020 | $340 | $7,725 | $2,000 | $5,725 |
| 2019 | $340 | $7,725 | $2,000 | $5,725 |
| 2018 | $340 | $7,725 | $2,000 | $5,725 |
| 2017 | $340 | $7,725 | $2,000 | $5,725 |
| 2016 | $340 | $7,725 | $2,000 | $5,725 |
| 2015 | $322 | $7,725 | $2,000 | $5,725 |
| 2014 | $355 | $8,525 | $2,000 | $6,525 |
Source: Public Records
Map
Nearby Homes