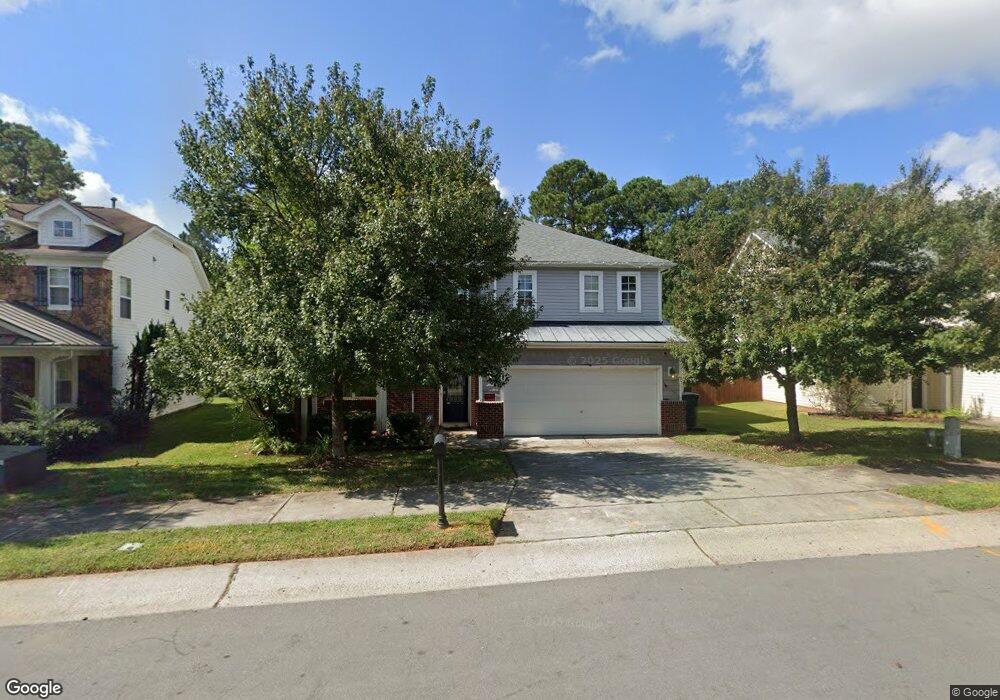
312 Rondelay Dr Durham, NC 27703
Eastern Durham NeighborhoodEstimated Value: $475,000 - $509,000
4
Beds
3
Baths
2,978
Sq Ft
$165/Sq Ft
Est. Value
About This Home
This home is located at 312 Rondelay Dr, Durham, NC 27703 and is currently estimated at $491,413, approximately $165 per square foot. 312 Rondelay Dr is a home located in Durham County with nearby schools including Spring Valley Elementary School, John W Neal Middle School, and Southern School of Energy & Sustainability.
Ownership History
Date
Name
Owned For
Owner Type
Purchase Details
Closed on
Apr 24, 2018
Sold by
Hege Brian and Hege Lindsay
Bought by
Carr Daniel William and Carr Melissa Sherance
Current Estimated Value
Home Financials for this Owner
Home Financials are based on the most recent Mortgage that was taken out on this home.
Original Mortgage
$277,382
Outstanding Balance
$244,110
Interest Rate
5.5%
Mortgage Type
FHA
Estimated Equity
$247,303
Purchase Details
Closed on
May 6, 2016
Sold by
Boswell Sean K
Bought by
Hege Brian and Hege Lindsay
Home Financials for this Owner
Home Financials are based on the most recent Mortgage that was taken out on this home.
Original Mortgage
$237,500
Interest Rate
3.59%
Purchase Details
Closed on
Sep 25, 2007
Sold by
Kb Home Raleigh Durham Inc
Bought by
Boswell Sean K and Boswell Ellen J
Home Financials for this Owner
Home Financials are based on the most recent Mortgage that was taken out on this home.
Original Mortgage
$200,000
Interest Rate
6.57%
Mortgage Type
Purchase Money Mortgage
Create a Home Valuation Report for This Property
The Home Valuation Report is an in-depth analysis detailing your home's value as well as a comparison with similar homes in the area
Home Values in the Area
Average Home Value in this Area
Purchase History
| Date | Buyer | Sale Price | Title Company |
|---|---|---|---|
| Carr Daniel William | $283,000 | None Available | |
| Hege Brian | $250,000 | -- | |
| Boswell Sean K | $223,000 | None Available |
Source: Public Records
Mortgage History
| Date | Status | Borrower | Loan Amount |
|---|---|---|---|
| Open | Carr Daniel William | $277,382 | |
| Previous Owner | Hege Brian | $237,500 | |
| Previous Owner | Boswell Sean K | $200,000 |
Source: Public Records
Tax History Compared to Growth
Tax History
| Year | Tax Paid | Tax Assessment Tax Assessment Total Assessment is a certain percentage of the fair market value that is determined by local assessors to be the total taxable value of land and additions on the property. | Land | Improvement |
|---|---|---|---|---|
| 2025 | $4,905 | $494,822 | $107,625 | $387,197 |
| 2024 | $3,885 | $278,511 | $49,280 | $229,231 |
| 2023 | $3,648 | $278,511 | $49,280 | $229,231 |
| 2022 | $3,565 | $278,511 | $49,280 | $229,231 |
| 2021 | $3,548 | $278,511 | $49,280 | $229,231 |
| 2020 | $3,464 | $278,511 | $49,280 | $229,231 |
| 2019 | $3,464 | $278,511 | $49,280 | $229,231 |
| 2018 | $3,246 | $239,317 | $36,960 | $202,357 |
| 2017 | $3,222 | $239,317 | $36,960 | $202,357 |
| 2016 | $3,114 | $263,042 | $36,960 | $226,082 |
| 2015 | $3,088 | $223,059 | $44,042 | $179,017 |
| 2014 | $3,088 | $223,059 | $44,042 | $179,017 |
Source: Public Records
Map
Nearby Homes
- 309 Rondelay Dr
- 634 Conover Rd
- 121 English Ivy Dr
- 633 Conover Rd
- 626 Ashburn Ln
- 641 Conover Rd Unit B
- 631 Conover Rd
- 619 Ashburn Ln
- 629 Conover Rd
- 620 Conover Rd
- 2 Red Sage Ct
- 613 Ashburn Ln
- 303 Holly Blossom Dr
- 339 Olive Branch Rd
- 1417 Underbrush Dr
- 427 Cottonseed Way
- 316 Vintage Holly Dr
- 621 Wellwater Ave
- 1130 Arbor Edge Ln
- 204 Hillview Dr
- 312 Rondelay Rd
- 314 Rondelay Dr
- 310 Rondelay Dr
- 316 Rondelay Dr
- 308 Rondelay Dr
- 318 Rondelay Dr
- 306 Rondelay Dr
- 311 Rondelay Dr
- 315 Rondelay Dr
- 320 Rondelay Dr
- 307 Rondelay Dr
- 317 Rondelay Dr
- 712 Ashburn Ln
- 305 Rondelay Dr
- 714 Ashburn Ln
- 321 Rondelay Dr
- 322 Rondelay Dr
- 303 Rondelay Dr
- 323 Rondelay Dr
- 324 Rondelay Dr