Estimated Value: $272,902 - $294,000
3
Beds
3
Baths
2,638
Sq Ft
$109/Sq Ft
Est. Value
About This Home
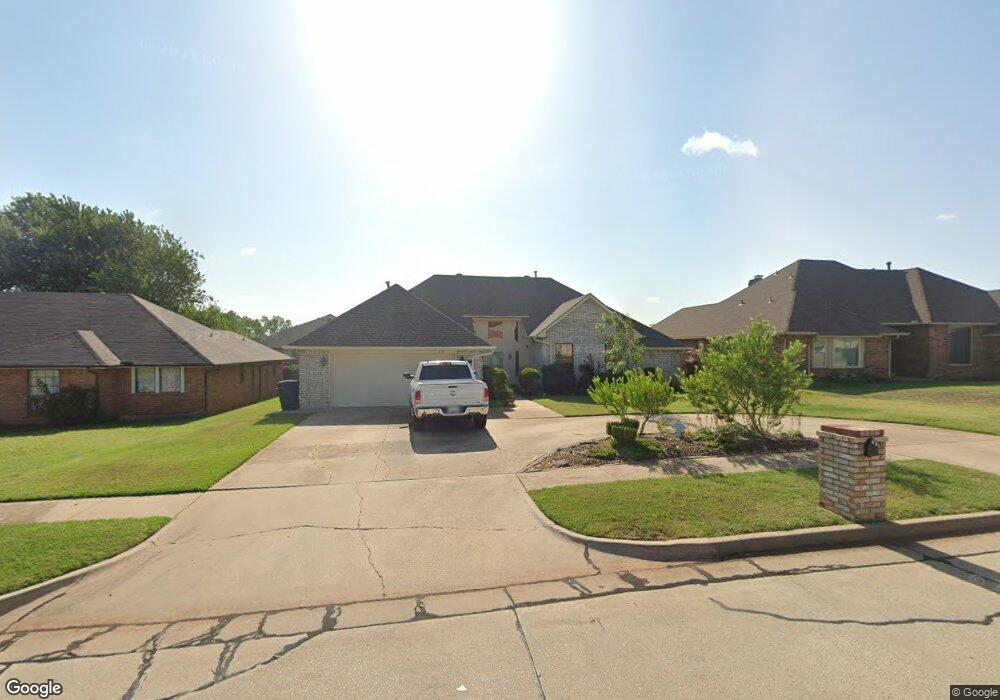
This home is located at 312 S Ramblin Oaks Dr, Moore, OK 73160 and is currently estimated at $287,726, approximately $109 per square foot. 312 S Ramblin Oaks Dr is a home located in Cleveland County with nearby schools including Apple Creek Elementary School, Highland East Junior High School, and Moore High School.
Ownership History
Date
Name
Owned For
Owner Type
Purchase Details
Closed on
Jan 11, 2012
Sold by
Cobble Kim A and Cobble Danna J
Bought by
Cobble Kim A and Cobble Danna J
Current Estimated Value
Home Financials for this Owner
Home Financials are based on the most recent Mortgage that was taken out on this home.
Original Mortgage
$141,600
Outstanding Balance
$16,323
Interest Rate
4.03%
Mortgage Type
New Conventional
Estimated Equity
$271,403
Purchase Details
Closed on
Jan 25, 2006
Sold by
Cobble Kim A
Bought by
Cobble Kim A and Cobble Danna J
Purchase Details
Closed on
Oct 21, 2005
Sold by
Davis Amy
Bought by
Cobble Kim A
Home Financials for this Owner
Home Financials are based on the most recent Mortgage that was taken out on this home.
Original Mortgage
$113,600
Interest Rate
5.69%
Mortgage Type
New Conventional
Create a Home Valuation Report for This Property
The Home Valuation Report is an in-depth analysis detailing your home's value as well as a comparison with similar homes in the area
Home Values in the Area
Average Home Value in this Area
Purchase History
| Date | Buyer | Sale Price | Title Company |
|---|---|---|---|
| Cobble Kim A | -- | Stewart Abstract & Title Of | |
| Cobble Kim A | -- | Stewart Abstract & Title Okl | |
| Cobble Kim A | -- | None Available | |
| Cobble Kim A | $142,000 | None Available |
Source: Public Records
Mortgage History
| Date | Status | Borrower | Loan Amount |
|---|---|---|---|
| Open | Cobble Kim A | $141,600 | |
| Closed | Cobble Kim A | $113,600 |
Source: Public Records
Tax History Compared to Growth
Tax History
| Year | Tax Paid | Tax Assessment Tax Assessment Total Assessment is a certain percentage of the fair market value that is determined by local assessors to be the total taxable value of land and additions on the property. | Land | Improvement |
|---|---|---|---|---|
| 2024 | $2,429 | $21,021 | $3,141 | $17,880 |
| 2023 | $2,366 | $20,408 | $2,769 | $17,639 |
| 2022 | $2,328 | $19,814 | $3,024 | $16,790 |
| 2021 | $2,266 | $19,237 | $2,760 | $16,477 |
| 2020 | $2,267 | $19,237 | $2,760 | $16,477 |
| 2019 | $2,309 | $19,237 | $2,760 | $16,477 |
| 2018 | $2,310 | $19,237 | $2,760 | $16,477 |
| 2017 | $2,322 | $19,237 | $0 | $0 |
| 2016 | $2,339 | $19,237 | $2,760 | $16,477 |
| 2015 | $2,054 | $18,708 | $2,684 | $16,024 |
| 2014 | $2,038 | $18,163 | $1,800 | $16,363 |
Source: Public Records
Map
Nearby Homes
- 204 S Morgan Dr
- 104 S Ramblin Oaks Dr
- 416 S English St
- 1517 SE 6th St
- 417 S Bouziden Dr
- 112 Wellington Ln
- 205 N Ramblin Oaks Dr
- 1809 Parkway Dr
- 308 S Patterson Dr
- 401 S Bryant Ave
- 221 N English Dr
- 708 S Avery Dr
- 812 S Avery St
- 701 S Patterson Dr
- 705 Cottonwood Dr
- 709 S Patterson Dr
- 2100 SE 5th St
- 1101 S English St
- 1105 Spruce Dr
- 1200 NE 5th St
- 308 S Ramblin Oaks Dr
- 304 S Ramblin Oaks Dr
- 320 S Ramblin Oaks Dr
- 1321 SE 3rd St
- 1320 SE 2nd St
- 300 S Ramblin Oaks Dr
- 400 S Ramblin Oaks Dr
- 1317 SE 3rd St
- 1316 SE 2nd St
- 1412 SE 2nd St
- 401 S Ramblin Oaks Dr
- 217 S Ramblin Oaks Dr
- 1316 SE 3rd St
- 1317 SE 2nd St
- 1313 SE 3rd St
- 1312 SE 2nd St
- 1405 SE 2nd St
- 1401 SE 2nd St
- 1409 SE 2nd St
- 1313 SE 2nd St