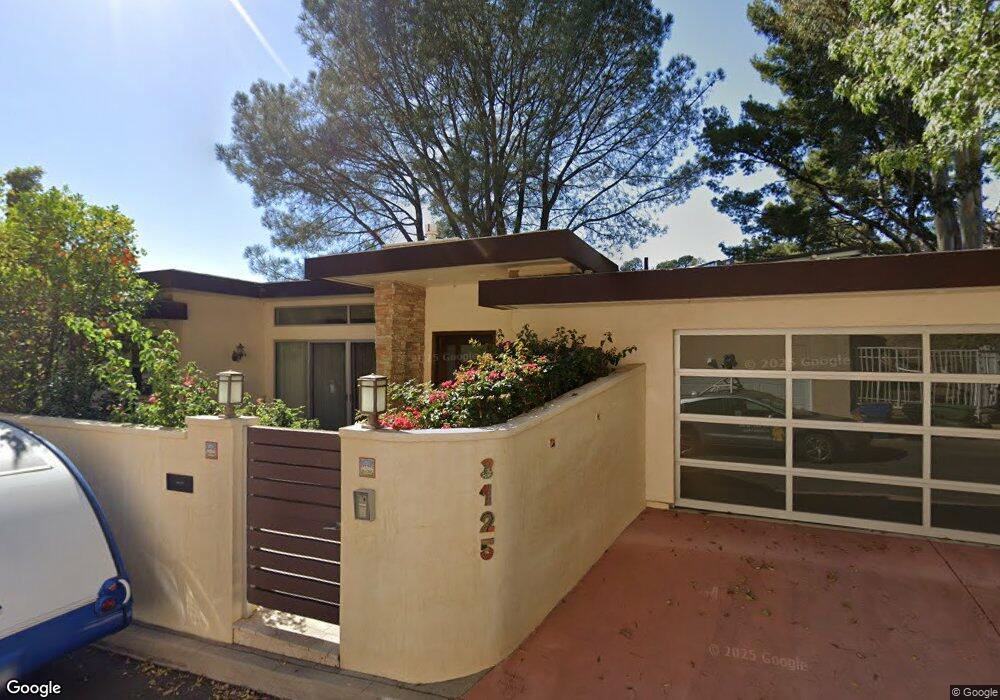
3125 Hollyridge Dr Los Angeles, CA 90068
Hollywood Hills NeighborhoodEstimated Value: $1,621,000 - $3,151,000
2
Beds
2
Baths
1,476
Sq Ft
$1,549/Sq Ft
Est. Value
About This Home
This home is located at 3125 Hollyridge Dr, Los Angeles, CA 90068 and is currently estimated at $2,286,022, approximately $1,548 per square foot. 3125 Hollyridge Dr is a home located in Los Angeles County with nearby schools including Cheremoya Avenue Elementary School, Joseph Le Conte Middle School, and Hollywood Senior High School.
Ownership History
Date
Name
Owned For
Owner Type
Purchase Details
Closed on
Jan 28, 2019
Sold by
Rikess Mark and Halperin Julia
Bought by
Rikess Mark and Halperin Julia
Current Estimated Value
Purchase Details
Closed on
Mar 18, 2015
Sold by
Rikess Mark and Halperin Julie H
Bought by
Rikess Mark and Halperin Julia
Home Financials for this Owner
Home Financials are based on the most recent Mortgage that was taken out on this home.
Original Mortgage
$850,000
Outstanding Balance
$650,293
Interest Rate
3.65%
Mortgage Type
Purchase Money Mortgage
Estimated Equity
$1,635,729
Purchase Details
Closed on
Mar 7, 2011
Sold by
Rikess Mark
Bought by
Rikess Mark and Halperin Julia H
Home Financials for this Owner
Home Financials are based on the most recent Mortgage that was taken out on this home.
Original Mortgage
$364,300
Interest Rate
4.45%
Mortgage Type
New Conventional
Purchase Details
Closed on
Oct 16, 1997
Sold by
Hastings Stephen R and Hastings Susan J
Bought by
Rikess Mark
Home Financials for this Owner
Home Financials are based on the most recent Mortgage that was taken out on this home.
Original Mortgage
$320,900
Interest Rate
7.49%
Create a Home Valuation Report for This Property
The Home Valuation Report is an in-depth analysis detailing your home's value as well as a comparison with similar homes in the area
Home Values in the Area
Average Home Value in this Area
Purchase History
| Date | Buyer | Sale Price | Title Company |
|---|---|---|---|
| Rikess Mark | -- | None Available | |
| Rikess Mark | -- | Lawyers Title Company | |
| Rikess Mark | -- | Lsi | |
| Rikess Mark | $357,000 | Southland Title Corporation |
Source: Public Records
Mortgage History
| Date | Status | Borrower | Loan Amount |
|---|---|---|---|
| Open | Rikess Mark | $850,000 | |
| Closed | Rikess Mark | $364,300 | |
| Closed | Rikess Mark | $320,900 |
Source: Public Records
Tax History Compared to Growth
Tax History
| Year | Tax Paid | Tax Assessment Tax Assessment Total Assessment is a certain percentage of the fair market value that is determined by local assessors to be the total taxable value of land and additions on the property. | Land | Improvement |
|---|---|---|---|---|
| 2025 | $11,487 | $935,382 | $399,181 | $536,201 |
| 2024 | $11,487 | $917,042 | $391,354 | $525,688 |
| 2023 | $11,269 | $899,062 | $383,681 | $515,381 |
| 2022 | $10,778 | $881,434 | $376,158 | $505,276 |
| 2021 | $10,639 | $864,152 | $368,783 | $495,369 |
| 2019 | $10,257 | $838,523 | $357,846 | $480,677 |
| 2018 | $10,224 | $822,082 | $350,830 | $471,252 |
| 2016 | $9,730 | $790,160 | $337,207 | $452,953 |
| 2015 | $7,284 | $589,294 | $332,142 | $257,152 |
| 2014 | $5,936 | $465,004 | $325,636 | $139,368 |
Source: Public Records
Map
Nearby Homes
- 6053 Rodgerton Dr
- 2940 N Beachwood Dr
- 3306 Deronda Dr
- 2980 Hollyridge Dr
- 2910 N Beachwood Dr
- 6180 Rockcliff Dr
- 3112 Ledgewood Dr
- 3105 Ledgewood Dr
- 3336 N Ledgewood Dr
- 6428 W Rodgerton Dr
- 2820 Westshire Dr
- 3279 Ledgewood Dr
- 3030 Durand Dr
- 2878 Belden Dr
- 3162 Durand Dr
- 6469 Rodgerton Dr
- 0 Belden Dr Unit SW25190661
- 2756 Westshire Dr
- 2781 Westshire Dr
- 6491 Rodgerton Dr
- 3133 Hollyridge Dr
- 3119 Hollyridge Dr
- 3080 N Beachwood Dr
- 3074 N Beachwood Dr
- 3100 N Beachwood Dr
- 3126 Hollyridge Dr
- 3132 Hollyridge Dr
- 3141 Hollyridge Dr
- 3120 Hollyridge Dr
- 3111 Hollyridge Dr
- 3068 N Beachwood Dr
- 3110 N Beachwood Dr
- 3140 Hollyridge Dr
- 3147 Hollyridge Dr
- 3110 Hollyridge Dr
- 3116 N Beachwood Dr
- 3064 N Beachwood Dr
- 3101 Hollyridge Dr
- 6009 Rodgerton Dr
- 3153 Hollyridge Dr