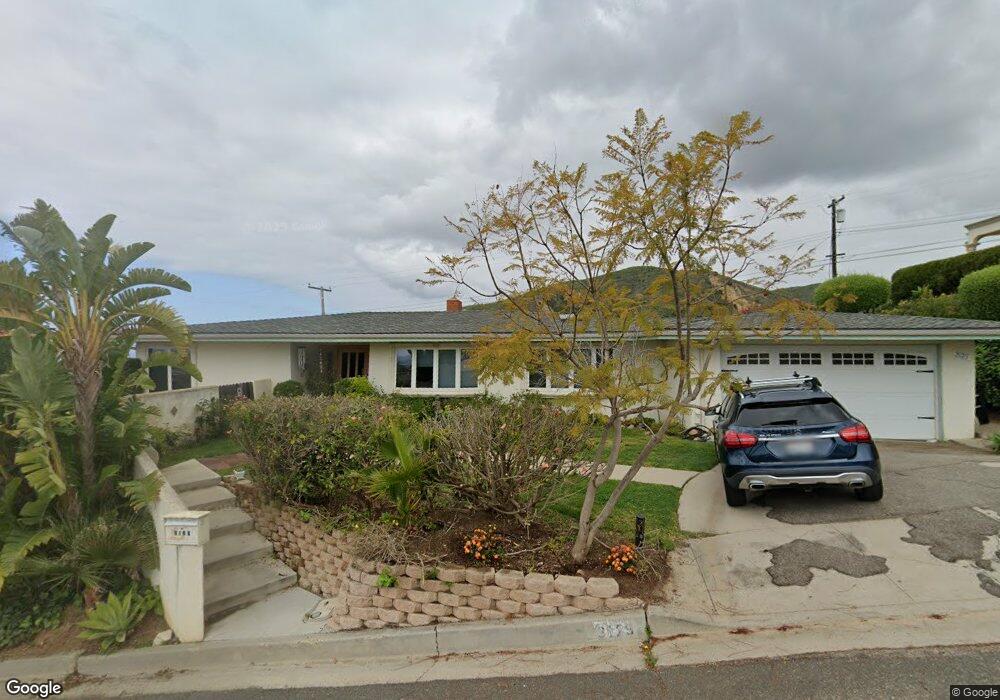
3129 Breaker Dr Ventura, CA 93003
Midtown NeighborhoodEstimated Value: $1,373,870 - $1,712,000
4
Beds
2
Baths
2,316
Sq Ft
$675/Sq Ft
Est. Value
About This Home
This home is located at 3129 Breaker Dr, Ventura, CA 93003 and is currently estimated at $1,563,218, approximately $674 per square foot. 3129 Breaker Dr is a home located in Ventura County with nearby schools including Loma Vista Elementary School, Cabrillo Middle School, and Ventura High School.
Ownership History
Date
Name
Owned For
Owner Type
Purchase Details
Closed on
Apr 11, 2012
Sold by
Ro Chin Mark S
Bought by
Ro Chin Siri
Current Estimated Value
Purchase Details
Closed on
Feb 27, 1996
Sold by
Warn Curtis and Warn Maureen M
Bought by
Rochin Mark Stuart and Rochin Siri
Home Financials for this Owner
Home Financials are based on the most recent Mortgage that was taken out on this home.
Original Mortgage
$206,500
Outstanding Balance
$8,348
Interest Rate
7.34%
Estimated Equity
$1,554,870
Purchase Details
Closed on
Aug 8, 1994
Sold by
Moore Sean K
Bought by
Warn Curtis and Warn Maureen M
Home Financials for this Owner
Home Financials are based on the most recent Mortgage that was taken out on this home.
Original Mortgage
$165,000
Interest Rate
5.75%
Create a Home Valuation Report for This Property
The Home Valuation Report is an in-depth analysis detailing your home's value as well as a comparison with similar homes in the area
Home Values in the Area
Average Home Value in this Area
Purchase History
| Date | Buyer | Sale Price | Title Company |
|---|---|---|---|
| Ro Chin Siri | -- | None Available | |
| Rochin Mark Stuart | $306,500 | Chicago Title Co | |
| Warn Curtis | $165,000 | Continental Lawyers Title |
Source: Public Records
Mortgage History
| Date | Status | Borrower | Loan Amount |
|---|---|---|---|
| Open | Rochin Mark Stuart | $206,500 | |
| Previous Owner | Warn Curtis | $165,000 |
Source: Public Records
Tax History Compared to Growth
Tax History
| Year | Tax Paid | Tax Assessment Tax Assessment Total Assessment is a certain percentage of the fair market value that is determined by local assessors to be the total taxable value of land and additions on the property. | Land | Improvement |
|---|---|---|---|---|
| 2025 | $5,425 | $500,504 | $290,698 | $209,806 |
| 2024 | $5,425 | $490,691 | $284,998 | $205,693 |
| 2023 | $5,359 | $481,070 | $279,410 | $201,660 |
| 2022 | $4,994 | $471,638 | $273,932 | $197,706 |
| 2021 | $4,898 | $462,391 | $268,561 | $193,830 |
| 2020 | $4,852 | $457,652 | $265,808 | $191,844 |
| 2019 | $4,762 | $448,680 | $260,597 | $188,083 |
| 2018 | $4,393 | $412,224 | $255,488 | $156,736 |
| 2017 | $4,584 | $431,260 | $250,479 | $180,781 |
| 2016 | $4,495 | $422,805 | $245,568 | $177,237 |
| 2015 | $4,447 | $416,456 | $241,880 | $174,576 |
| 2014 | $4,374 | $408,300 | $237,143 | $171,157 |
Source: Public Records
Map
Nearby Homes
- 3124 Grove St
- 505 Briarwood Terrace
- 2407 Sunset Dr
- 2542 Poli St
- 251 Palomares Ave
- 114 San Marino Ave
- 2418 Lexington Dr
- 3302 San Luis St
- 33 Glen Ellen Dr
- 3750 Mound Ave
- 325 N Catalina St
- 69 S Seaward Ave
- Plan D at Portalvo - Townhomes
- Plan F at Portalvo - Townhomes
- Plan E at Portalvo - Townhomes
- Plan O at Portalvo - Condos/Flats
- Plan A at Portalvo - Townhomes
- Plan H at Portalvo - Condos/Flats
- Plan L at Portalvo - Condos/Flats
- Plan C at Portalvo - Townhomes
- 3143 Breaker Dr
- 3115 Breaker Dr
- 3103 Island View Dr
- 3140 Breaker Ct
- 3157 Breaker Dr
- 3101 Breaker Dr
- 3100 Island View Dr
- 3125 Island View Dr
- 3112 Island View Dr
- 3136 Breaker Ct
- 3154 Breaker Ct
- 3032 Hilltop Dr
- 3124 Island View Dr
- 3171 Breaker Dr
- 3026 Hilltop Dr
- 3147 Island View Dr
- 3051 Hilltop Dr
- 3107 Hilltop Dr
- 3136 Island View Dr
- 3033 Grove Ln