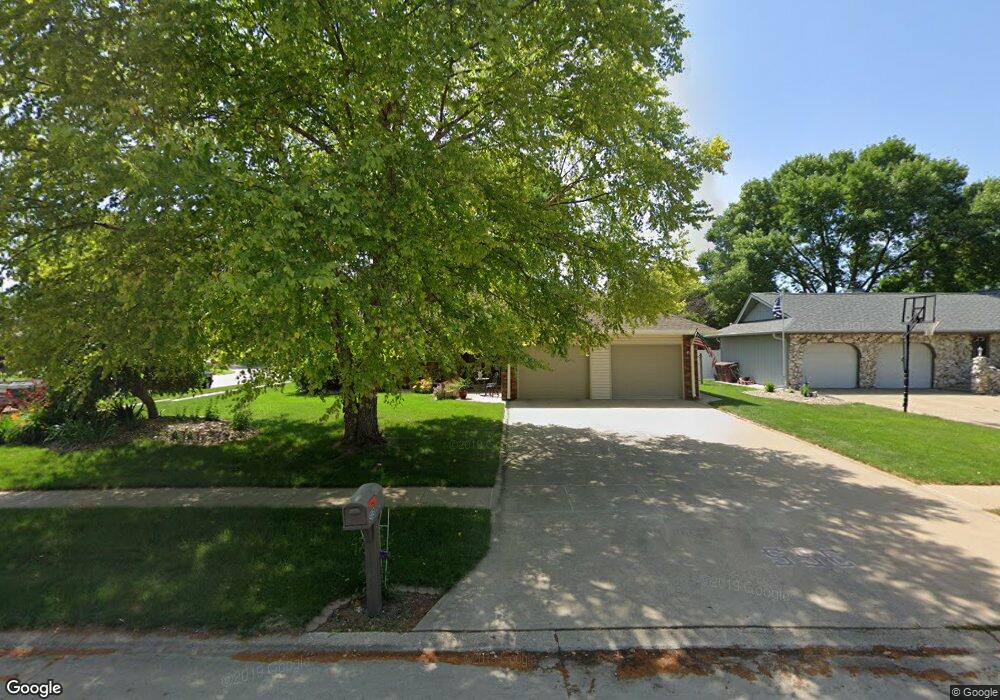
313 Broadmoor Dr South Sioux City, NE 68776
Estimated Value: $270,653 - $361,000
4
Beds
3
Baths
2,902
Sq Ft
$108/Sq Ft
Est. Value
About This Home
This home is located at 313 Broadmoor Dr, South Sioux City, NE 68776 and is currently estimated at $314,663, approximately $108 per square foot. 313 Broadmoor Dr is a home located in Dakota County with nearby schools including Covington Elementary School, South Sioux City Middle School, and South Sioux Senior High School.
Ownership History
Date
Name
Owned For
Owner Type
Purchase Details
Closed on
Jun 19, 2012
Sold by
Krueger Christopher L and Krueger Kasey L
Bought by
Jessen Robert D and Jessen Rebecca
Current Estimated Value
Home Financials for this Owner
Home Financials are based on the most recent Mortgage that was taken out on this home.
Original Mortgage
$150,000
Outstanding Balance
$104,101
Interest Rate
3.86%
Mortgage Type
New Conventional
Estimated Equity
$210,562
Purchase Details
Closed on
Aug 6, 2009
Sold by
Archer Gerald L and Archer Jacquelyn J
Bought by
Krueger Christopher L and Krueger Kasey L
Home Financials for this Owner
Home Financials are based on the most recent Mortgage that was taken out on this home.
Original Mortgage
$153,900
Interest Rate
5%
Mortgage Type
Adjustable Rate Mortgage/ARM
Purchase Details
Closed on
May 24, 2001
Sold by
Winkelman John N and Winkelman Barbara E
Bought by
Archer Gerald L and Archer Jacquelyn J
Create a Home Valuation Report for This Property
The Home Valuation Report is an in-depth analysis detailing your home's value as well as a comparison with similar homes in the area
Home Values in the Area
Average Home Value in this Area
Purchase History
| Date | Buyer | Sale Price | Title Company |
|---|---|---|---|
| Jessen Robert D | -- | None Available | |
| Krueger Christopher L | $163,000 | -- | |
| Archer Gerald L | $110,000 | -- |
Source: Public Records
Mortgage History
| Date | Status | Borrower | Loan Amount |
|---|---|---|---|
| Open | Jessen Robert D | $150,000 | |
| Previous Owner | Krueger Christopher L | $153,900 |
Source: Public Records
Tax History Compared to Growth
Tax History
| Year | Tax Paid | Tax Assessment Tax Assessment Total Assessment is a certain percentage of the fair market value that is determined by local assessors to be the total taxable value of land and additions on the property. | Land | Improvement |
|---|---|---|---|---|
| 2024 | $2,795 | $218,405 | $27,040 | $191,365 |
| 2023 | $3,815 | $214,835 | $26,000 | $188,835 |
| 2022 | $3,408 | $178,215 | $26,000 | $152,215 |
| 2021 | $3,554 | $179,290 | $26,000 | $153,290 |
| 2020 | $3,526 | $176,345 | $26,000 | $150,345 |
| 2019 | $3,536 | $176,345 | $26,000 | $150,345 |
| 2018 | $3,586 | $177,400 | $26,000 | $151,400 |
| 2017 | $3,256 | $161,410 | $26,000 | $135,410 |
| 2016 | $2,802 | $141,285 | $26,000 | $115,285 |
| 2014 | $2,717 | $131,945 | $14,400 | $117,545 |
Source: Public Records
Map
Nearby Homes
- 114 Oakmont Dr
- 424 S Ridge Dr
- 214 W 31st St
- 389 Willow Gardens
- 3312 Cedar Mill Way
- 3200 Cider Mill Way
- 2434 U S 77
- 125 E 30th St
- 300 Kerri Ln
- 324 Regency Ct
- 202 E 23rd St
- 605 Stagecoach Rd
- 825 Ash St
- 3819 Crescent Ln
- 405 W 17th St
- 509 142nd St
- 2101 F St
- 3722 Le Mesa Way
- 1401 & 1402 5th Ave
- 314 E 17th St
- 309 Broadmoor Dr
- 100 Burning Tree Cir
- 101 Burning Tree Cir
- 312 Broadmoor Dr
- 305 Broadmoor Dr
- 308 Broadmoor Dr
- 105 Burning Tree Cir
- 316 Broadmoor Dr
- 321 Broadmoor Dr
- 104 Burning Tree Cir
- 109 Burning Tree Cir
- 304 Broadmoor Dr
- 104 Tamarack Ln
- 320 Broadmoor Dr
- 108 Parkview Dr
- 108 Tamarack Ln
- 112 Parkview Dr
- 401 Broadmoor Dr
- 104 Parkview Dr
- 324 Broadmoor Dr