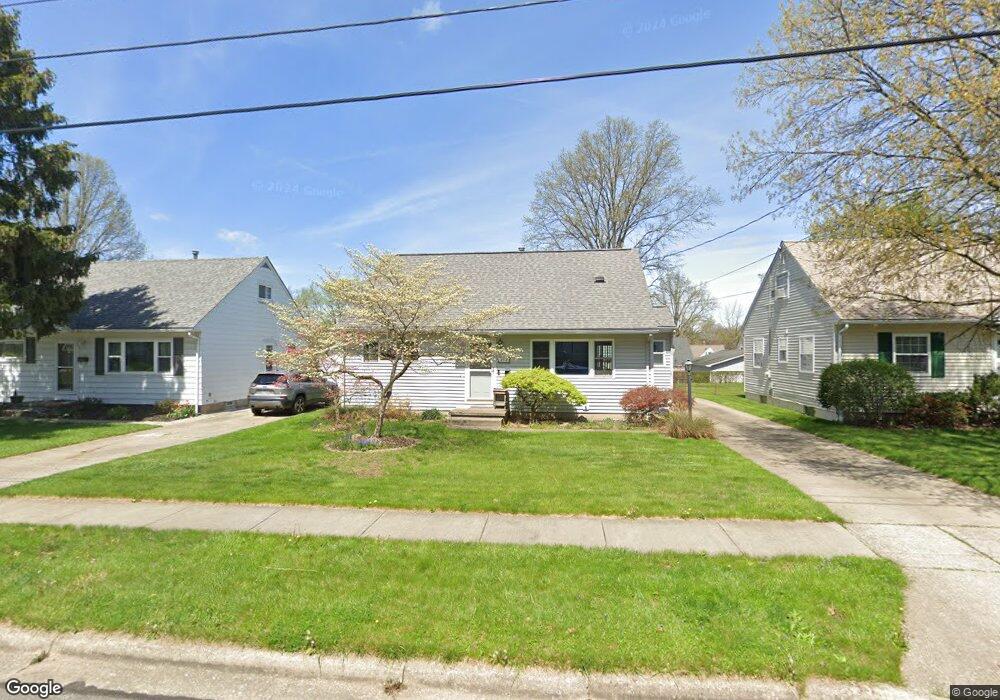
313 Lehigh Ave Cuyahoga Falls, OH 44221
Mud Brook NeighborhoodEstimated Value: $205,000 - $242,000
3
Beds
2
Baths
884
Sq Ft
$252/Sq Ft
Est. Value
About This Home
This home is located at 313 Lehigh Ave, Cuyahoga Falls, OH 44221 and is currently estimated at $222,553, approximately $251 per square foot. 313 Lehigh Ave is a home located in Summit County with nearby schools including Lincoln Elementary School, Roberts Middle School, and Cuyahoga Falls High School.
Ownership History
Date
Name
Owned For
Owner Type
Purchase Details
Closed on
Jun 14, 2010
Sold by
Lero Stanley J
Bought by
Lero Sudonna M
Current Estimated Value
Create a Home Valuation Report for This Property
The Home Valuation Report is an in-depth analysis detailing your home's value as well as a comparison with similar homes in the area
Home Values in the Area
Average Home Value in this Area
Purchase History
| Date | Buyer | Sale Price | Title Company |
|---|---|---|---|
| Lero Sudonna M | -- | Attorney |
Source: Public Records
Tax History Compared to Growth
Tax History
| Year | Tax Paid | Tax Assessment Tax Assessment Total Assessment is a certain percentage of the fair market value that is determined by local assessors to be the total taxable value of land and additions on the property. | Land | Improvement |
|---|---|---|---|---|
| 2025 | $3,052 | $56,526 | $12,198 | $44,328 |
| 2024 | $3,052 | $56,526 | $12,198 | $44,328 |
| 2023 | $3,052 | $56,526 | $12,198 | $44,328 |
| 2022 | $2,744 | $41,283 | $8,775 | $32,508 |
| 2021 | $2,744 | $41,283 | $8,775 | $32,508 |
| 2020 | $2,699 | $41,290 | $8,780 | $32,510 |
| 2019 | $2,776 | $38,680 | $8,430 | $30,250 |
| 2018 | $2,358 | $38,680 | $8,430 | $30,250 |
| 2017 | $2,183 | $38,680 | $8,430 | $30,250 |
| 2016 | $2,185 | $36,300 | $8,430 | $27,870 |
| 2015 | $2,183 | $36,300 | $8,430 | $27,870 |
| 2014 | $2,184 | $36,300 | $8,430 | $27,870 |
| 2013 | $2,218 | $37,170 | $8,430 | $28,740 |
Source: Public Records
Map
Nearby Homes
- 435 Roanoke Ave
- 455 Marguerite Ave
- 306 Hollywood Ave
- 3044 Bailey Rd
- 2886 Norwood St
- 2890 Bailey Rd
- 419 Keenan Ave
- 3320 Hudson Dr
- 2835 Bailey Rd
- 2834 Norwood St
- 229 Hayes Ave
- Greenfield Plan at Miller's Landing
- Riverton Plan at Miller's Landing
- Woodside Plan at Miller's Landing
- Willwood Plan at Miller's Landing
- Westchester Plan at Miller's Landing
- Amberwood Plan at Miller's Landing
- Hilltop Plan at Miller's Landing
- 242 Monroe Ave
- 223 Filmore Ave
- 319 Lehigh Ave
- 307 Lehigh Ave
- 335 Lehigh Ave
- 301 Lehigh Ave
- 318 Lehigh Ave
- 316 Orrville Ave
- 312 Lehigh Ave
- 310 Orrville Ave
- 306 Lehigh Ave
- 302 Orrville Ave
- 324 Lehigh Ave
- 243 Lehigh Ave
- 322 Orrville Ave
- 300 Lehigh Ave
- 246 Orrville Ave
- 330 Lehigh Ave
- 3140 Norwood St
- 328 Orrville Ave
- 242 Lehigh Ave
- 235 Lehigh Ave