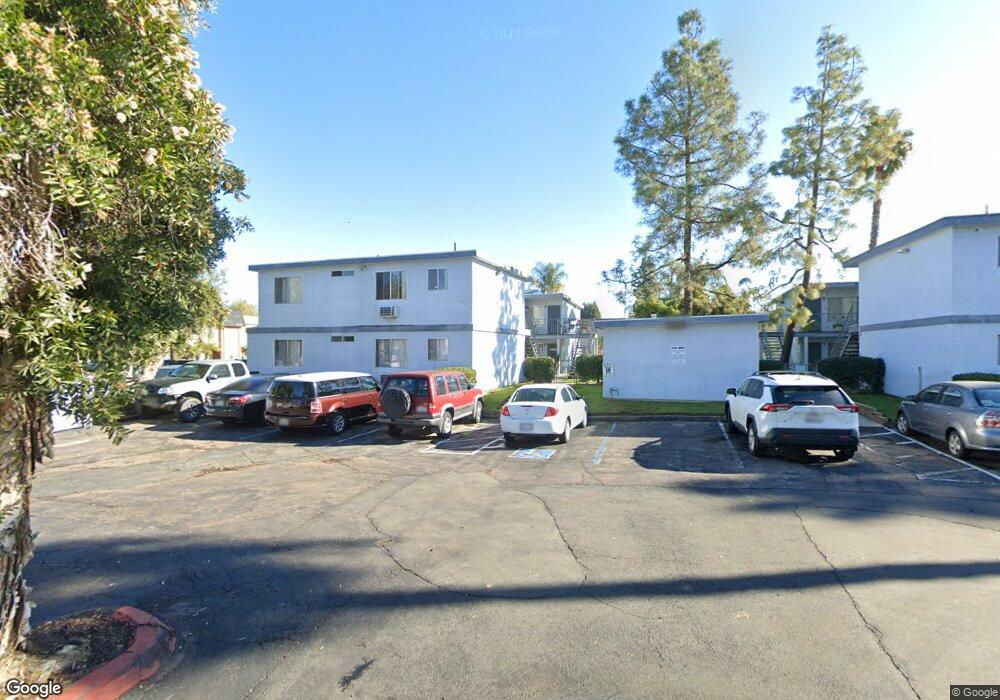
313 S Mollison Ave Unit 2 El Cajon, CA 92020
Estimated Value: $432,579 - $462,000
2
Beds
2
Baths
1,104
Sq Ft
$405/Sq Ft
Est. Value
About This Home
This home is located at 313 S Mollison Ave Unit 2, El Cajon, CA 92020 and is currently estimated at $446,895, approximately $404 per square foot. 313 S Mollison Ave Unit 2 is a home located in San Diego County with nearby schools including Anza Elementary School, Cajon Valley Middle School, and El Cajon Valley High School.
Ownership History
Date
Name
Owned For
Owner Type
Purchase Details
Closed on
Feb 13, 2023
Sold by
Toma Latifa Oraha
Bought by
Latifa Toma Living Trust and Toma
Current Estimated Value
Purchase Details
Closed on
Nov 30, 2010
Sold by
Toma Said
Bought by
Toma Said and Toma Latifa Oraha
Purchase Details
Closed on
Sep 23, 2009
Sold by
Pope Donald G and Pope Aisha D
Bought by
Toma Said
Purchase Details
Closed on
Apr 8, 2004
Sold by
Mollison Estates Llc
Bought by
Pope Donald G and Pope Aisha D
Home Financials for this Owner
Home Financials are based on the most recent Mortgage that was taken out on this home.
Original Mortgage
$231,884
Interest Rate
5.5%
Mortgage Type
Purchase Money Mortgage
Create a Home Valuation Report for This Property
The Home Valuation Report is an in-depth analysis detailing your home's value as well as a comparison with similar homes in the area
Home Values in the Area
Average Home Value in this Area
Purchase History
| Date | Buyer | Sale Price | Title Company |
|---|---|---|---|
| Latifa Toma Living Trust | -- | None Listed On Document | |
| Toma Said | -- | None Available | |
| Toma Said | $98,000 | Multiple | |
| Pope Donald G | $290,000 | Southland Title |
Source: Public Records
Mortgage History
| Date | Status | Borrower | Loan Amount |
|---|---|---|---|
| Previous Owner | Pope Donald G | $231,884 | |
| Closed | Pope Donald G | $57,971 |
Source: Public Records
Tax History Compared to Growth
Tax History
| Year | Tax Paid | Tax Assessment Tax Assessment Total Assessment is a certain percentage of the fair market value that is determined by local assessors to be the total taxable value of land and additions on the property. | Land | Improvement |
|---|---|---|---|---|
| 2025 | $1,517 | $125,191 | $33,901 | $91,290 |
| 2024 | $1,517 | $122,737 | $33,237 | $89,500 |
| 2023 | $1,478 | $120,332 | $32,586 | $87,746 |
| 2022 | $1,455 | $117,974 | $31,948 | $86,026 |
| 2021 | $1,435 | $115,662 | $31,322 | $84,340 |
| 2020 | $1,420 | $114,477 | $31,001 | $83,476 |
| 2019 | $1,403 | $112,234 | $30,394 | $81,840 |
| 2018 | $1,380 | $110,035 | $29,799 | $80,236 |
| 2017 | $30 | $107,878 | $29,215 | $78,663 |
| 2016 | $1,309 | $105,764 | $28,643 | $77,121 |
| 2015 | $1,302 | $104,176 | $28,213 | $75,963 |
| 2014 | $1,278 | $102,136 | $27,661 | $74,475 |
Source: Public Records
Map
Nearby Homes
- 267 S Mollison Ave Unit 16
- 267 S Mollison Ave Unit 5
- 486 S Anza St
- 855 E Lexington Ave Unit 4
- 605 S Mollison Ave Unit 205
- 471 S Lincoln Ave
- 606 S Mollison Ave Unit A
- 410 S 1st St Unit 185
- 410 S 1st St Unit 30
- 410 S 1st St Unit 145
- 410 S 1st St Unit 138
- 410 S 1st St Unit 197
- 410 S 1st St Unit 157
- 410 S 1st St Unit 94
- 410 S 1st St Unit 156
- 410 S 1st St Unit 175
- 410 S 1st St Unit 158
- 410 S 1st St Unit 35
- 410 S 1st St Unit 199
- 410 S 1st St Unit 131
- 317 S Mollison Ave
- 321 S Mollison Ave
- 303 S Mollison Ave
- 303 S Mollison Ave Unit 3
- 303 S Mollison Ave Unit 2
- 323 S Mollison Ave Unit 3
- 323 S Mollison Ave Unit 2
- 323 S Mollison Ave Unit 1
- 321 S Mollison Ave Unit 4
- 321 S Mollison Ave Unit 3
- 321 S Mollison Ave Unit 2
- 319 S Mollison Ave Unit 4
- 319 S Mollison Ave Unit 3
- 319 S Mollison Ave Unit 2
- 319 S Mollison Ave Unit 1
- 317 S Mollison Ave Unit 4
- 317 S Mollison Ave Unit 3
- 313 S Mollison Ave Unit 4
- 313 S Mollison Ave Unit 3
- 313 S Mollison Ave Unit 1