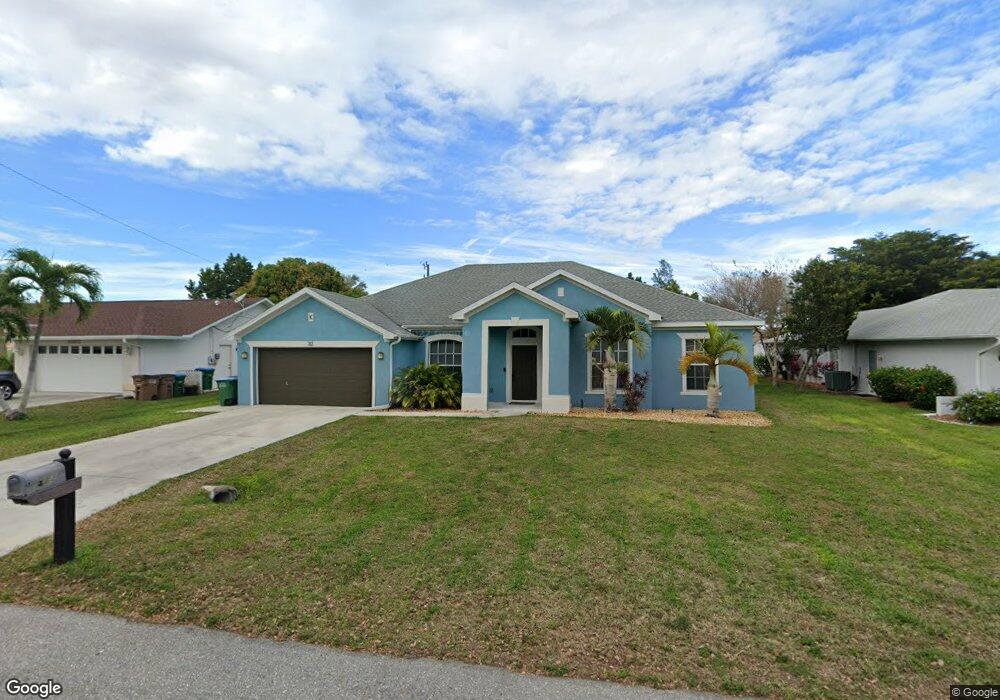
313 SE 30th St Cape Coral, FL 33904
Caloosahatchee NeighborhoodEstimated Value: $414,000 - $602,000
3
Beds
2
Baths
2,946
Sq Ft
$163/Sq Ft
Est. Value
About This Home
This home is located at 313 SE 30th St, Cape Coral, FL 33904 and is currently estimated at $481,205, approximately $163 per square foot. 313 SE 30th St is a home located in Lee County with nearby schools including Cape Elementary School, Caloosa Elementary School, and Tropic Isles Elementary School.
Ownership History
Date
Name
Owned For
Owner Type
Purchase Details
Closed on
Apr 14, 2010
Sold by
Duke Ronnie
Bought by
Kramer Devon P
Current Estimated Value
Home Financials for this Owner
Home Financials are based on the most recent Mortgage that was taken out on this home.
Original Mortgage
$181,649
Outstanding Balance
$123,942
Interest Rate
5.5%
Mortgage Type
FHA
Estimated Equity
$357,263
Purchase Details
Closed on
Jun 9, 2009
Sold by
Uc Home Inc
Bought by
Duke Ronnie
Purchase Details
Closed on
Apr 14, 2009
Sold by
Escobedo Saul
Bought by
Uc Homes Inc Catalina Invest Llc
Purchase Details
Closed on
Jul 31, 2006
Sold by
David Weekley Homes Llc
Bought by
Escobedo Saul and Escobedo Araceli
Home Financials for this Owner
Home Financials are based on the most recent Mortgage that was taken out on this home.
Original Mortgage
$311,903
Interest Rate
9.85%
Mortgage Type
Unknown
Purchase Details
Closed on
Dec 2, 2004
Sold by
Fleig Milford A and Mcintosh Margaret
Bought by
David Weekley Homes Llc
Create a Home Valuation Report for This Property
The Home Valuation Report is an in-depth analysis detailing your home's value as well as a comparison with similar homes in the area
Home Values in the Area
Average Home Value in this Area
Purchase History
| Date | Buyer | Sale Price | Title Company |
|---|---|---|---|
| Kramer Devon P | $185,000 | Cape Coral Title Ins Agency | |
| Duke Ronnie | $171,000 | Attorney | |
| Uc Homes Inc Catalina Invest Llc | $153,000 | None Available | |
| Escobedo Saul | $346,600 | Town Square Title Company | |
| David Weekley Homes Llc | $69,900 | Town Square Title Company |
Source: Public Records
Mortgage History
| Date | Status | Borrower | Loan Amount |
|---|---|---|---|
| Open | Kramer Devon P | $181,649 | |
| Previous Owner | Escobedo Saul | $311,903 |
Source: Public Records
Tax History Compared to Growth
Tax History
| Year | Tax Paid | Tax Assessment Tax Assessment Total Assessment is a certain percentage of the fair market value that is determined by local assessors to be the total taxable value of land and additions on the property. | Land | Improvement |
|---|---|---|---|---|
| 2025 | $2,989 | $175,110 | -- | -- |
| 2024 | $2,849 | $170,175 | -- | -- |
| 2023 | $2,849 | $165,218 | $0 | $0 |
| 2022 | $2,615 | $160,406 | $0 | $0 |
| 2021 | $2,626 | $295,628 | $34,692 | $260,936 |
| 2020 | $2,645 | $153,584 | $0 | $0 |
| 2019 | $2,562 | $150,131 | $0 | $0 |
| 2018 | $2,545 | $147,332 | $0 | $0 |
| 2017 | $2,526 | $144,302 | $0 | $0 |
| 2016 | $2,457 | $222,133 | $23,730 | $198,403 |
| 2015 | $2,460 | $199,902 | $16,879 | $183,023 |
| 2014 | $2,381 | $177,605 | $13,700 | $163,905 |
| 2013 | -- | $159,004 | $9,800 | $149,204 |
Source: Public Records
Map
Nearby Homes
- 244 SE 30th Terrace
- 320 SE 28th Terrace Unit 26
- 321 SE 31st St
- 309 SE 28th Terrace
- 3021 SE 5th Ave
- 419 SE 28th Terrace
- 313 SE 31st Terrace
- 304 Kamal Pkwy
- 418 SE 31st St
- 212 SE 30th Terrace
- 230 Kamal Pkwy
- 502 SE 31st St
- 143 SE 30th Terrace
- 207 SE 31st St
- 142 SE 30th Terrace
- 130 SE 29th Terrace
- 3006 SE 6th Ave
- 3014 SE 6th Ave
- 212 SE 31st Terrace
- 157 Kamal Pkwy
- 317 SE 30th St
- 309 SE 30th St
- 309 SE 30 St
- 316 SE 29th Terrace
- 310 SE 29th Terrace
- 321 SE 30th St
- 305 SE 30th St
- 312 SE 30th St
- 308 SE 30th St
- 316 SE 30th St
- 320 SE 29th Terrace Unit 26
- 304 SE 29th Terrace
- 320 SE 30th St
- 304 SE 30th St
- 325 SE 30th St
- 301 SE 30th St
- 324 SE 29th Terrace
- 300 SE 29th Terrace
- 300 SE 30th St
- 313 SE 30th Terrace