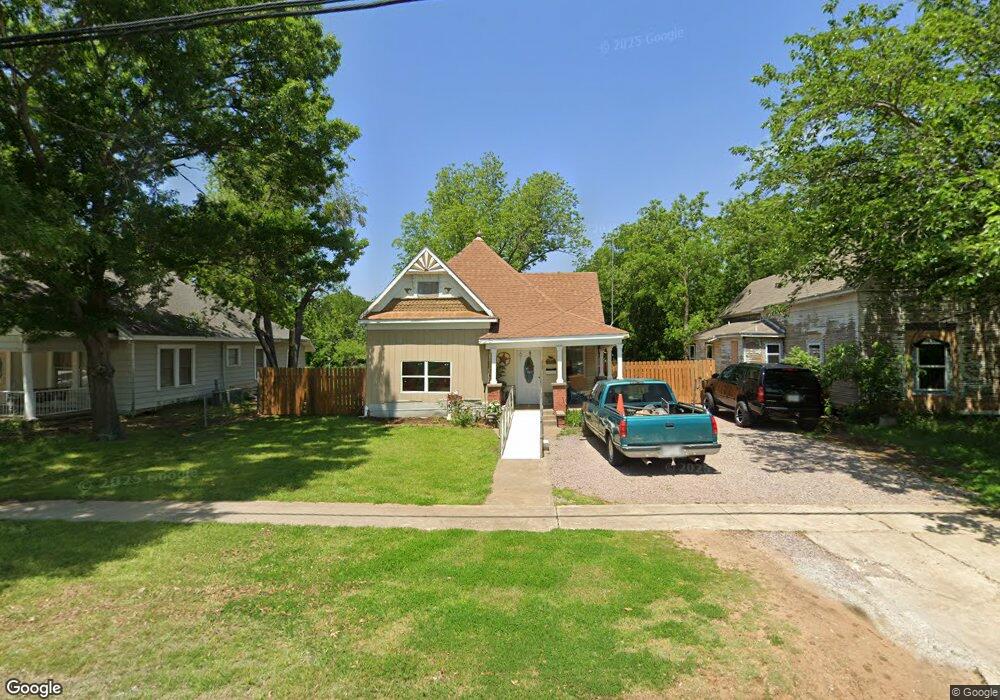
313 W Main St Whitesboro, TX 76273
Estimated Value: $146,611 - $244,000
--
Bed
--
Bath
1,239
Sq Ft
$158/Sq Ft
Est. Value
About This Home
This home is located at 313 W Main St, Whitesboro, TX 76273 and is currently estimated at $195,306, approximately $157 per square foot. 313 W Main St is a home located in Grayson County with nearby schools including J.W. Hayes Primary School, Whitesboro Intermediate School, and Whitesboro Middle School.
Ownership History
Date
Name
Owned For
Owner Type
Purchase Details
Closed on
Dec 7, 2006
Sold by
Brown Tresa Renee and Herod Renee Mayo
Bought by
Broadway Production Inc
Current Estimated Value
Home Financials for this Owner
Home Financials are based on the most recent Mortgage that was taken out on this home.
Original Mortgage
$15,500
Outstanding Balance
$9,262
Interest Rate
6.3%
Mortgage Type
Purchase Money Mortgage
Estimated Equity
$186,044
Create a Home Valuation Report for This Property
The Home Valuation Report is an in-depth analysis detailing your home's value as well as a comparison with similar homes in the area
Home Values in the Area
Average Home Value in this Area
Purchase History
| Date | Buyer | Sale Price | Title Company |
|---|---|---|---|
| Broadway Production Inc | -- | None Available |
Source: Public Records
Mortgage History
| Date | Status | Borrower | Loan Amount |
|---|---|---|---|
| Open | Broadway Production Inc | $15,500 |
Source: Public Records
Tax History Compared to Growth
Tax History
| Year | Tax Paid | Tax Assessment Tax Assessment Total Assessment is a certain percentage of the fair market value that is determined by local assessors to be the total taxable value of land and additions on the property. | Land | Improvement |
|---|---|---|---|---|
| 2025 | $2,152 | $109,205 | $47,131 | $62,074 |
| 2024 | $2,152 | $109,260 | $45,509 | $63,751 |
| 2023 | $2,003 | $111,103 | $44,467 | $66,636 |
| 2022 | $2,045 | $103,747 | $48,752 | $54,995 |
| 2021 | $1,766 | $82,357 | $31,498 | $50,859 |
| 2020 | $1,847 | $82,729 | $28,718 | $54,011 |
| 2019 | $1,576 | $67,119 | $15,980 | $51,139 |
| 2018 | $1,565 | $65,423 | $15,980 | $49,443 |
| 2017 | $1,492 | $61,636 | $12,506 | $49,130 |
| 2016 | $1,364 | $56,358 | $7,527 | $48,831 |
| 2015 | $857 | $34,957 | $7,527 | $27,430 |
| 2014 | $863 | $35,176 | $7,527 | $27,649 |
Source: Public Records
Map
Nearby Homes