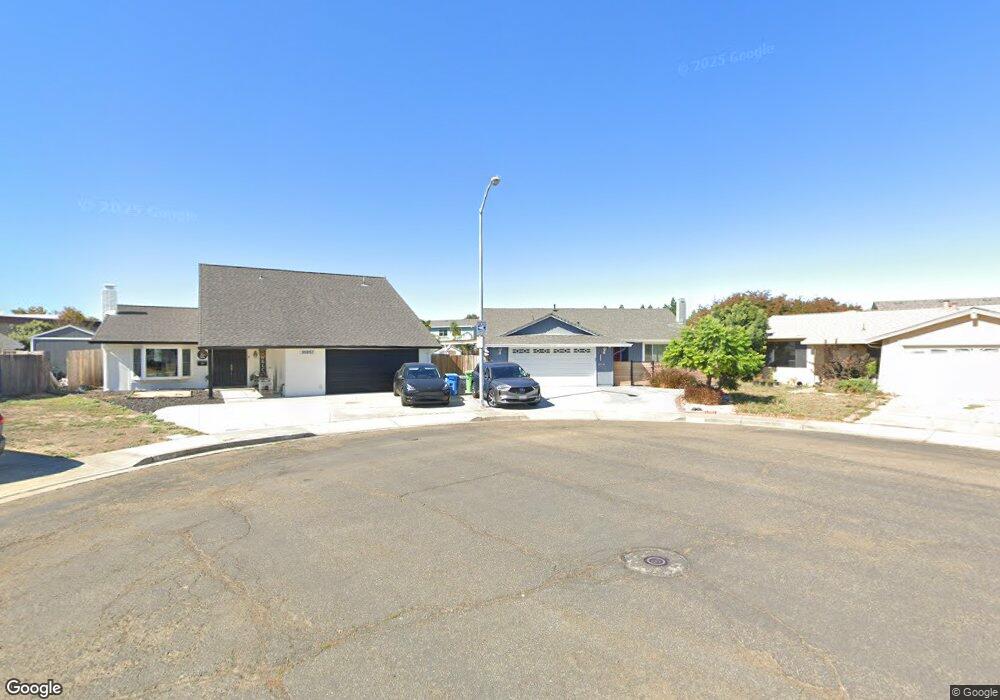
31353 San Bruno Ct Union City, CA 94587
Alvarado NeighborhoodEstimated Value: $1,344,000 - $1,557,932
4
Beds
2
Baths
2,020
Sq Ft
$709/Sq Ft
Est. Value
About This Home
This home is located at 31353 San Bruno Ct, Union City, CA 94587 and is currently estimated at $1,431,483, approximately $708 per square foot. 31353 San Bruno Ct is a home located in Alameda County with nearby schools including Alvarado Elementary School, Itliong-Vera Cruz, and James Logan High School.
Ownership History
Date
Name
Owned For
Owner Type
Purchase Details
Closed on
Feb 20, 2019
Sold by
Tajalle William S and Tajalle Gwen M
Bought by
Peng Renee M and Roldan Yessenia
Current Estimated Value
Home Financials for this Owner
Home Financials are based on the most recent Mortgage that was taken out on this home.
Original Mortgage
$760,000
Outstanding Balance
$666,814
Interest Rate
4.4%
Mortgage Type
New Conventional
Estimated Equity
$764,669
Create a Home Valuation Report for This Property
The Home Valuation Report is an in-depth analysis detailing your home's value as well as a comparison with similar homes in the area
Home Values in the Area
Average Home Value in this Area
Purchase History
| Date | Buyer | Sale Price | Title Company |
|---|---|---|---|
| Peng Renee M | $950,000 | Chicago Title Company |
Source: Public Records
Mortgage History
| Date | Status | Borrower | Loan Amount |
|---|---|---|---|
| Open | Peng Renee M | $760,000 |
Source: Public Records
Tax History Compared to Growth
Tax History
| Year | Tax Paid | Tax Assessment Tax Assessment Total Assessment is a certain percentage of the fair market value that is determined by local assessors to be the total taxable value of land and additions on the property. | Land | Improvement |
|---|---|---|---|---|
| 2025 | $14,457 | $1,059,724 | $317,917 | $741,807 |
| 2024 | $14,457 | $1,038,947 | $311,684 | $727,263 |
| 2023 | $14,040 | $1,018,580 | $305,574 | $713,006 |
| 2022 | $13,821 | $998,611 | $299,583 | $699,028 |
| 2021 | $13,515 | $979,031 | $293,709 | $685,322 |
| 2020 | $13,212 | $969,000 | $290,700 | $678,300 |
| 2019 | $3,827 | $199,657 | $48,103 | $151,554 |
| 2018 | $3,732 | $195,742 | $47,160 | $148,582 |
| 2017 | $3,639 | $191,904 | $46,235 | $145,669 |
| 2016 | $3,510 | $188,142 | $45,329 | $142,813 |
| 2015 | $3,435 | $185,317 | $44,648 | $140,669 |
| 2014 | $3,305 | $181,688 | $43,774 | $137,914 |
Source: Public Records
Map
Nearby Homes
- 4100 Aquarius Cir
- 3178 Santa Marta Ct
- 32542 Lake Tana St
- 4214 Saturn Way
- 4167 Sunflower Ct
- 4201 Saturn Way
- 4243 Comet Cir
- 4263 Queen Anne Dr
- 31274 Santa Maria Dr
- 3305 San Carlos Way
- 4231 Hanford St
- 4506 Birchwood Ct
- 30996 Granger Ave
- 32451 Regents Blvd
- 3501 Lake Ontario Dr
- 4633 Granada Way
- 4532 Delores Dr
- 33010 Lake Mead Dr
- 33162 Lake Pyramid St
- 30651 Carr Way
- 31357 San Bruno Ct
- 31349 San Bruno Ct
- 3288 Santa Sophia Ct
- 3284 Santa Sophia Ct
- 3292 Santa Sophia Ct
- 31361 San Bruno Ct
- 3280 Santa Sophia Ct
- 31345 San Bruno Ct
- 31365 San Bruno Ct
- 3276 Santa Sophia Ct
- 31369 San Bruno Ct
- 3283 Santa Sophia Ct
- 3279 Santa Sophia Ct
- 3287 Santa Sophia Ct
- 3295 Santa Sophia Ct
- 3280 Santa Paula Way
- 3252 San Andreas Dr
- 3291 Santa Sophia Ct
- 3275 Santa Sophia Ct
- 3275 Santa Paula Way