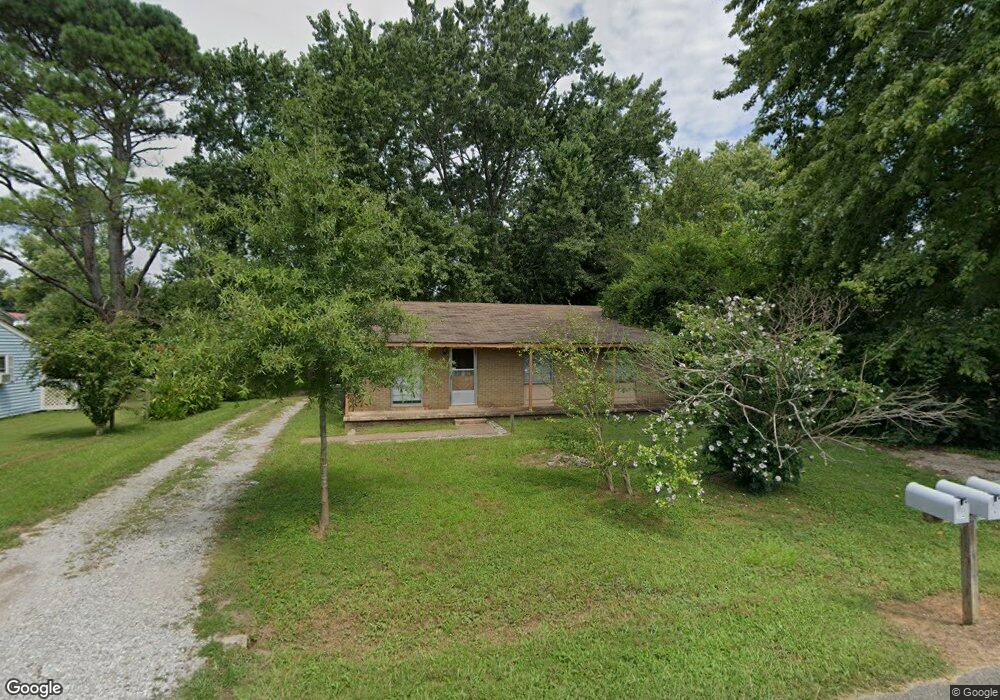
314 Brannon St Lawrenceburg, TN 38464
Estimated Value: $148,545 - $188,000
--
Bed
2
Baths
1,000
Sq Ft
$170/Sq Ft
Est. Value
About This Home
This home is located at 314 Brannon St, Lawrenceburg, TN 38464 and is currently estimated at $169,886, approximately $169 per square foot. 314 Brannon St is a home located in Lawrence County with nearby schools including Ingram Sowell Elementary School, David Crockett Elementary School, and Lawrenceburg Public Elementary School.
Ownership History
Date
Name
Owned For
Owner Type
Purchase Details
Closed on
Mar 18, 2016
Sold by
Citifinancial Servicing Llc
Bought by
White John Mark
Current Estimated Value
Purchase Details
Closed on
Sep 16, 2015
Sold by
Warwick Jack
Bought by
Citi Financial Servicing Llc
Purchase Details
Closed on
Dec 18, 2003
Sold by
Etal Bumpas James Heir
Bought by
Jack Warwick
Purchase Details
Closed on
Jun 27, 1979
Bought by
Bumpas Barbara
Purchase Details
Closed on
Jan 1, 1979
Create a Home Valuation Report for This Property
The Home Valuation Report is an in-depth analysis detailing your home's value as well as a comparison with similar homes in the area
Home Values in the Area
Average Home Value in this Area
Purchase History
| Date | Buyer | Sale Price | Title Company |
|---|---|---|---|
| White John Mark | $18,500 | -- | |
| Citi Financial Servicing Llc | -- | -- | |
| Citifinancial Servicing Llc | $17,626 | -- | |
| Jack Warwick | $35,000 | -- | |
| Bumpas Barbara | -- | -- | |
| -- | $22,000 | -- |
Source: Public Records
Tax History Compared to Growth
Tax History
| Year | Tax Paid | Tax Assessment Tax Assessment Total Assessment is a certain percentage of the fair market value that is determined by local assessors to be the total taxable value of land and additions on the property. | Land | Improvement |
|---|---|---|---|---|
| 2025 | $716 | $23,025 | $0 | $0 |
| 2024 | $716 | $23,025 | $2,500 | $20,525 |
| 2023 | $716 | $23,025 | $2,500 | $20,525 |
| 2022 | $716 | $23,025 | $2,500 | $20,525 |
| 2021 | $524 | $11,925 | $2,000 | $9,925 |
| 2020 | $524 | $11,925 | $2,000 | $9,925 |
| 2019 | $524 | $11,925 | $2,000 | $9,925 |
| 2018 | $524 | $11,925 | $2,000 | $9,925 |
| 2017 | $563 | $12,800 | $2,000 | $10,800 |
| 2016 | $563 | $12,800 | $2,000 | $10,800 |
| 2015 | $533 | $12,800 | $2,000 | $10,800 |
| 2014 | $514 | $12,350 | $2,000 | $10,350 |
Source: Public Records
Map
Nearby Homes