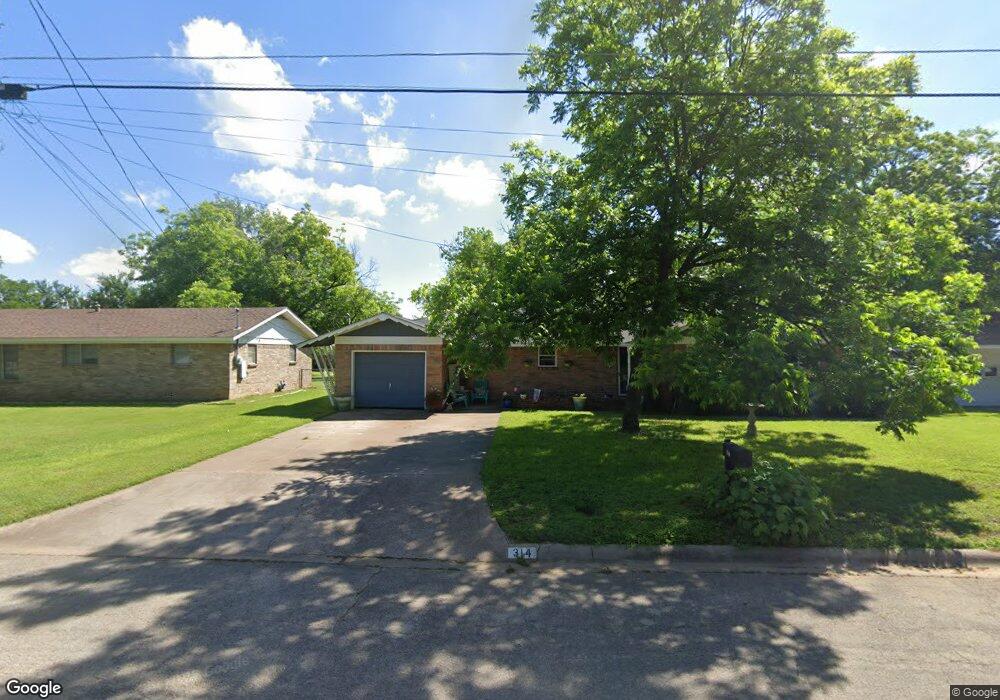
314 Stroud St Cleburne, TX 76033
Estimated Value: $217,827 - $250,000
3
Beds
2
Baths
1,555
Sq Ft
$151/Sq Ft
Est. Value
About This Home
This home is located at 314 Stroud St, Cleburne, TX 76033 and is currently estimated at $235,457, approximately $151 per square foot. 314 Stroud St is a home located in Johnson County with nearby schools including Coleman Elementary School, A.D. Wheat Middle School, and Cleburne High School.
Ownership History
Date
Name
Owned For
Owner Type
Purchase Details
Closed on
Dec 5, 2011
Sold by
Hampton Frances M
Bought by
Beebe Gerry
Current Estimated Value
Home Financials for this Owner
Home Financials are based on the most recent Mortgage that was taken out on this home.
Original Mortgage
$79,800
Outstanding Balance
$54,928
Interest Rate
4.14%
Mortgage Type
New Conventional
Estimated Equity
$180,529
Purchase Details
Closed on
Mar 30, 2009
Sold by
Keever Mellanie Lee
Bought by
Hampton Frances M
Home Financials for this Owner
Home Financials are based on the most recent Mortgage that was taken out on this home.
Original Mortgage
$72,000
Interest Rate
5.14%
Mortgage Type
Purchase Money Mortgage
Purchase Details
Closed on
Dec 5, 2008
Sold by
Keever Roy B
Bought by
Keever Melanie Lee
Purchase Details
Closed on
Apr 24, 2006
Sold by
Lee Yoko
Bought by
Keever Mellanie Lee
Create a Home Valuation Report for This Property
The Home Valuation Report is an in-depth analysis detailing your home's value as well as a comparison with similar homes in the area
Home Values in the Area
Average Home Value in this Area
Purchase History
| Date | Buyer | Sale Price | Title Company |
|---|---|---|---|
| Beebe Gerry | -- | Providence Title | |
| Hampton Frances M | -- | Rtt | |
| Keever Melanie Lee | -- | None Available | |
| Keever Mellanie Lee | -- | None Available |
Source: Public Records
Mortgage History
| Date | Status | Borrower | Loan Amount |
|---|---|---|---|
| Open | Beebe Gerry | $79,800 | |
| Previous Owner | Hampton Frances M | $72,000 |
Source: Public Records
Tax History Compared to Growth
Tax History
| Year | Tax Paid | Tax Assessment Tax Assessment Total Assessment is a certain percentage of the fair market value that is determined by local assessors to be the total taxable value of land and additions on the property. | Land | Improvement |
|---|---|---|---|---|
| 2025 | $2,042 | $160,094 | $39,000 | $121,094 |
| 2024 | $3,375 | $151,382 | $0 | $0 |
| 2023 | $1,747 | $159,594 | $38,500 | $121,094 |
| 2022 | $3,131 | $150,594 | $29,500 | $121,094 |
| 2021 | $2,967 | $150,594 | $29,500 | $121,094 |
| 2020 | $2,865 | $141,094 | $20,000 | $121,094 |
| 2019 | $2,777 | $141,094 | $20,000 | $121,094 |
| 2018 | $2,526 | $88,489 | $26,500 | $61,989 |
| 2017 | $2,287 | $77,682 | $19,250 | $58,432 |
| 2016 | $2,196 | $74,600 | $13,500 | $61,100 |
| 2015 | $2,038 | $74,600 | $13,500 | $61,100 |
| 2014 | $2,038 | $76,452 | $13,500 | $62,952 |
Source: Public Records
Map
Nearby Homes
- 311 N Pendell Ave
- 1016 Sheridan Ln
- 106 Glen Rose Ave
- 1006 Princeton Place
- 911 W Chambers St
- 101 S Pendell Ave
- 1300 Belvon Place
- 604 Mcanear St
- 1102 Lena St
- 104 Dixon St
- 618 Woodard Ave
- 114 S Field St
- 415 Featherston St
- 618 Granbury St
- 1307 Joslin St
- 306 Prairie Ave
- 215 Sunset Dr
- 107 Woodard Ave
- 404 Forrest Ave
- 204 S Walnut St
- 312 Stroud St
- 316 Stroud St
- 310 Stroud St
- 1101 Center St
- 318 Stroud St
- 313 N Pendell Ave
- 315 N Pendell Ave
- 308 Stroud St
- 1102 Chester St
- 309 N Pendell Ave
- 317 N Pendell Ave
- 1103 Center St
- 320 Stroud St
- 1102 Center St
- 306 Stroud St
- 1104 Chester St
- 307 N Pendell Ave
- 319 N Pendell Ave
- 1105 Center St
- 322 Stroud St