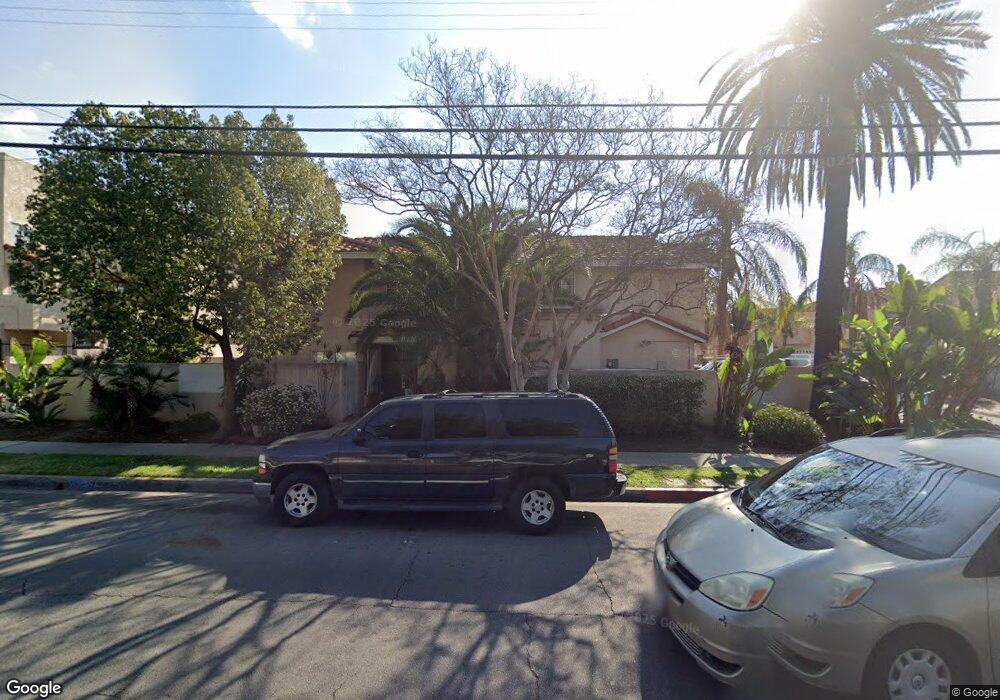
3142 Vineland Ave Baldwin Park, CA 91706
Estimated Value: $680,000 - $785,000
3
Beds
3
Baths
1,505
Sq Ft
$472/Sq Ft
Est. Value
About This Home
This home is located at 3142 Vineland Ave, Baldwin Park, CA 91706 and is currently estimated at $709,779, approximately $471 per square foot. 3142 Vineland Ave is a home located in Los Angeles County with nearby schools including Foster Elementary, Charles D. Jones Junior High School, and Baldwin Park High School.
Ownership History
Date
Name
Owned For
Owner Type
Purchase Details
Closed on
Oct 16, 2012
Sold by
Yu Sze Lap Henry and Yu Sze Lap
Bought by
Liang Rui Yan
Current Estimated Value
Purchase Details
Closed on
Mar 22, 2011
Sold by
Federal Home Loan Mortgage Corporation
Bought by
Liang Ruiyan and Yu Sze Lap
Purchase Details
Closed on
Jul 8, 2010
Sold by
Torres Mireya
Bought by
Federal Home Loan Mortgage Corporation
Purchase Details
Closed on
Mar 25, 2002
Sold by
Moran Leonor
Bought by
Torres Mireya
Home Financials for this Owner
Home Financials are based on the most recent Mortgage that was taken out on this home.
Original Mortgage
$167,200
Interest Rate
8.5%
Purchase Details
Closed on
Nov 15, 2000
Sold by
Chang Victoria
Bought by
Moran Leonor
Home Financials for this Owner
Home Financials are based on the most recent Mortgage that was taken out on this home.
Original Mortgage
$100,000
Interest Rate
7.86%
Create a Home Valuation Report for This Property
The Home Valuation Report is an in-depth analysis detailing your home's value as well as a comparison with similar homes in the area
Home Values in the Area
Average Home Value in this Area
Purchase History
| Date | Buyer | Sale Price | Title Company |
|---|---|---|---|
| Liang Rui Yan | -- | None Available | |
| Liang Ruiyan | $285,000 | Ticor Title Riverside | |
| Federal Home Loan Mortgage Corporation | $268,215 | Servicelink | |
| Torres Mireya | $209,000 | Commonwealth Land Title Co | |
| Moran Leonor | $165,000 | Southland Title |
Source: Public Records
Mortgage History
| Date | Status | Borrower | Loan Amount |
|---|---|---|---|
| Previous Owner | Torres Mireya | $167,200 | |
| Previous Owner | Moran Leonor | $100,000 |
Source: Public Records
Tax History Compared to Growth
Tax History
| Year | Tax Paid | Tax Assessment Tax Assessment Total Assessment is a certain percentage of the fair market value that is determined by local assessors to be the total taxable value of land and additions on the property. | Land | Improvement |
|---|---|---|---|---|
| 2025 | $4,668 | $365,122 | $160,525 | $204,597 |
| 2024 | $4,668 | $357,964 | $157,378 | $200,586 |
| 2023 | $4,620 | $350,946 | $154,293 | $196,653 |
| 2022 | $4,710 | $344,066 | $151,268 | $192,798 |
| 2021 | $4,637 | $337,320 | $148,302 | $189,018 |
| 2020 | $4,627 | $333,862 | $146,782 | $187,080 |
| 2019 | $4,348 | $327,316 | $143,904 | $183,412 |
| 2018 | $4,123 | $320,899 | $141,083 | $179,816 |
| 2016 | $3,875 | $308,440 | $135,605 | $172,835 |
| 2015 | $3,986 | $303,808 | $133,569 | $170,239 |
| 2014 | $3,929 | $297,858 | $130,953 | $166,905 |
Source: Public Records
Map
Nearby Homes
- 3060 Vineland Ave Unit 7
- 1735 Puente Ave Unit 30
- 3355 Vineland Ave
- 14360 Merced Ave
- 3314 Baldwin Park Blvd
- 13974 Francisquito Ave Unit 8
- 13655 Foster Ave Unit 2
- 3537 Maine Ave
- 1718 Puente Ave Unit 40
- 3632 Jackson Way
- 1416 Millbury Ave
- 3729 Baldwin Park Blvd
- 13522 Francisquito Ave Unit C
- 1311 S Leland Ave
- 13438 Francisquito Ave
- 14104 Barrydale St
- 3004 Via Delores
- 1240 S Bromley Ave
- 1525 Bromley Ave
- 3902 Bresee Ave Unit 14
- 3144 Vineland Ave
- 3140 Vineland Ave
- 3114 Vineland Ave
- 3116 Vineland Ave
- 3112 Vineland Ave
- 3118 Vineland Ave
- 3146 Vineland Ave
- 3120 Vineland Ave
- 3138 Vineland Ave
- 3139 Vineland Ave
- 3122 Vineland Ave
- 3141 Vineland Ave
- 3154 Vineland Ave Unit B
- 3154 Vineland Ave Unit A
- 3156 Vineland Ave Unit B
- 3156 Vineland Ave Unit A
- 3152 Vineland Ave Unit B
- 3152 Vineland Ave Unit A
- 3136 Vineland Ave
- 3124 Vineland Ave