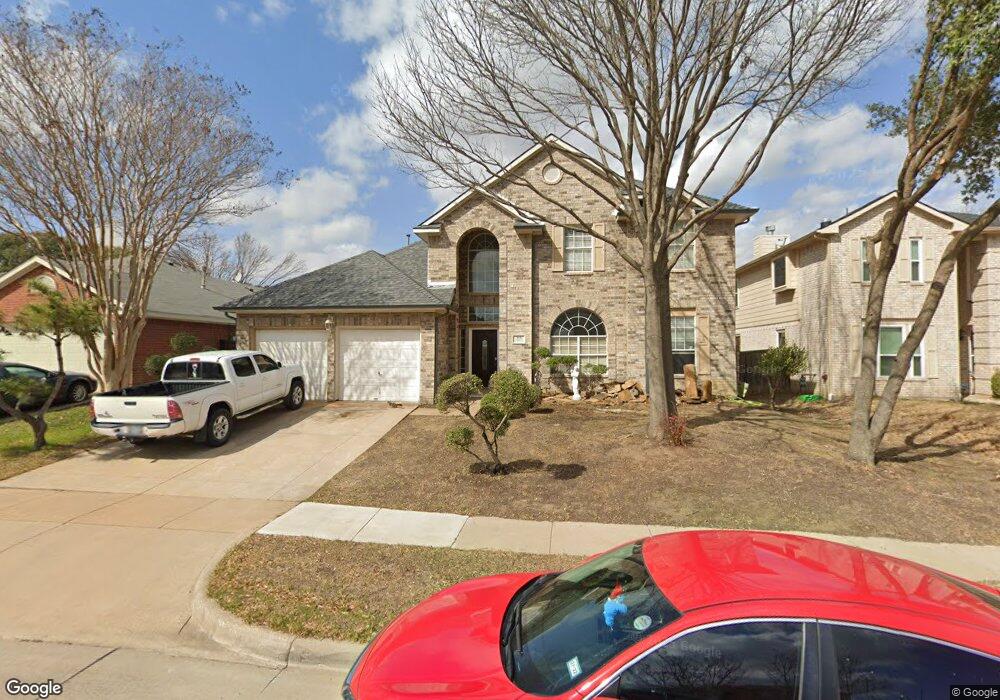
315 Crestview Dr Arlington, TX 76018
South East Arlington NeighborhoodEstimated Value: $351,000 - $391,150
3
Beds
2
Baths
2,329
Sq Ft
$161/Sq Ft
Est. Value
About This Home
This home is located at 315 Crestview Dr, Arlington, TX 76018 and is currently estimated at $374,538, approximately $160 per square foot. 315 Crestview Dr is a home located in Tarrant County with nearby schools including Williams Elementary School, Ousley Jr. High School, and Seguin High School.
Ownership History
Date
Name
Owned For
Owner Type
Purchase Details
Closed on
Nov 27, 2015
Sold by
Trinh Tiffany and La Andrew
Bought by
Trinh Thong
Current Estimated Value
Purchase Details
Closed on
Nov 18, 2015
Sold by
Trinh Tyler and Trinh Kim
Bought by
Trinh Thong
Purchase Details
Closed on
Mar 10, 1998
Sold by
Poulain Marc Christopher and Poulain Ann M
Bought by
Trinh Tyler T and Trinh Thong T
Home Financials for this Owner
Home Financials are based on the most recent Mortgage that was taken out on this home.
Original Mortgage
$117,800
Outstanding Balance
$21,760
Interest Rate
7.13%
Estimated Equity
$352,778
Purchase Details
Closed on
Apr 10, 1996
Sold by
Centex Real Estate Corp
Bought by
Poulain Marc Christopher and Poulain Ann M
Home Financials for this Owner
Home Financials are based on the most recent Mortgage that was taken out on this home.
Original Mortgage
$118,000
Interest Rate
7.42%
Mortgage Type
FHA
Create a Home Valuation Report for This Property
The Home Valuation Report is an in-depth analysis detailing your home's value as well as a comparison with similar homes in the area
Home Values in the Area
Average Home Value in this Area
Purchase History
| Date | Buyer | Sale Price | Title Company |
|---|---|---|---|
| Trinh Thong | -- | None Available | |
| Trinh Thong | -- | None Available | |
| Trinh Tyler T | -- | Chicago Title Insurance Co | |
| Poulain Marc Christopher | -- | Centex Title Co |
Source: Public Records
Mortgage History
| Date | Status | Borrower | Loan Amount |
|---|---|---|---|
| Open | Trinh Tyler T | $117,800 | |
| Previous Owner | Poulain Marc Christopher | $118,000 |
Source: Public Records
Tax History Compared to Growth
Tax History
| Year | Tax Paid | Tax Assessment Tax Assessment Total Assessment is a certain percentage of the fair market value that is determined by local assessors to be the total taxable value of land and additions on the property. | Land | Improvement |
|---|---|---|---|---|
| 2025 | $6,409 | $411,210 | $64,683 | $346,527 |
| 2024 | $6,409 | $411,210 | $64,683 | $346,527 |
| 2023 | $7,572 | $390,142 | $55,000 | $335,142 |
| 2022 | $7,759 | $332,243 | $55,000 | $277,243 |
| 2021 | $7,369 | $286,471 | $55,000 | $231,471 |
| 2020 | $6,475 | $257,835 | $55,000 | $202,835 |
| 2019 | $6,224 | $248,803 | $55,000 | $193,803 |
| 2018 | $5,040 | $217,808 | $30,000 | $187,808 |
| 2017 | $5,270 | $201,840 | $30,000 | $171,840 |
| 2016 | $4,791 | $180,006 | $30,000 | $150,006 |
| 2015 | $3,943 | $149,500 | $18,000 | $131,500 |
| 2014 | $3,943 | $158,500 | $18,000 | $140,500 |
Source: Public Records
Map
Nearby Homes
- 211 Ember Glen Dr
- 221 Kalmia Dr
- 805 W Embercrest Dr
- 711 Netherland Place
- 400 Kalmia Dr
- 818 Edgemont Dr
- 206 Nettletree St
- 4711 N Prairieview Ct
- 611 Bristlecone Dr
- 5314 Umbrella Pine Ct
- 5315 Umbrella Pine Ct
- 901 Freestone Ct
- 5002 Prairieview Ct S
- 906 Lemontree Ct
- 908 Highcrest Ct
- 5301 Carpenter Dr
- 603 Nightshade Dr
- 641 Lemon Dr
- 924 Thistle Ridge Ln
- 900 Cornfield Dr
- 311 Crestview Dr
- 317 Crestview Dr
- 309 Crestview Dr
- 319 Crestview Dr
- 314 Crestview Dr
- 310 Crestview Dr
- 318 Crestview Dr
- 307 Crestview Dr
- 321 Crestview Dr
- 308 Crestview Dr
- 320 Crestview Dr
- 305 Crestview Dr
- 306 Crestview Dr
- 323 Crestview Dr
- 322 Crestview Dr
- 305 Fairhaven Ct
- 304 Crestview Dr
- 309 Fairhaven Ct
- 303 Crestview Dr
- 301 Fairhaven Ct