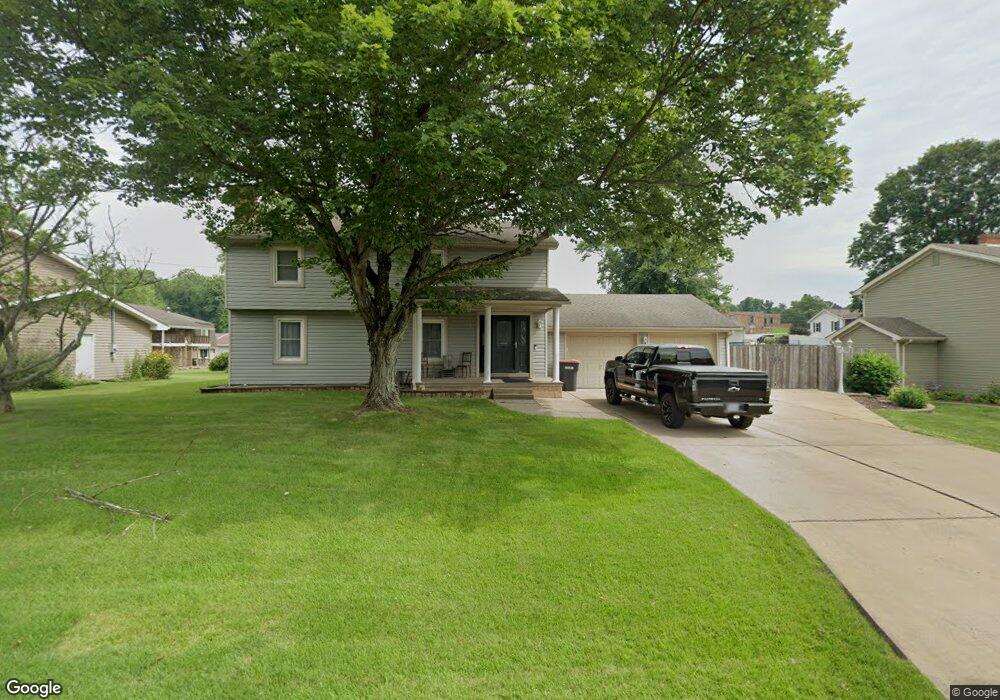
315 Imperial Dr East Liverpool, OH 43920
Estimated Value: $265,000 - $310,000
4
Beds
2
Baths
3,140
Sq Ft
$90/Sq Ft
Est. Value
About This Home
This home is located at 315 Imperial Dr, East Liverpool, OH 43920 and is currently estimated at $283,997, approximately $90 per square foot. 315 Imperial Dr is a home located in Columbiana County with nearby schools including Westgate Middle School, North Elementary School, and East Liverpool High School.
Ownership History
Date
Name
Owned For
Owner Type
Purchase Details
Closed on
Jun 30, 2020
Sold by
Rose Kara A and Heffner Kara
Bought by
Heffner Randy E
Current Estimated Value
Purchase Details
Closed on
Nov 1, 2012
Sold by
Heffner Randy E
Bought by
Heffner Randy E and Heffner Kara
Home Financials for this Owner
Home Financials are based on the most recent Mortgage that was taken out on this home.
Original Mortgage
$184,417
Outstanding Balance
$126,952
Interest Rate
3.31%
Mortgage Type
VA
Estimated Equity
$157,045
Purchase Details
Closed on
Jun 16, 2004
Sold by
Bourne June Marie and Bourne Robert J
Bought by
Heffner Randy E and Heffner Judith E
Home Financials for this Owner
Home Financials are based on the most recent Mortgage that was taken out on this home.
Original Mortgage
$187,799
Interest Rate
6.17%
Mortgage Type
VA
Create a Home Valuation Report for This Property
The Home Valuation Report is an in-depth analysis detailing your home's value as well as a comparison with similar homes in the area
Home Values in the Area
Average Home Value in this Area
Purchase History
| Date | Buyer | Sale Price | Title Company |
|---|---|---|---|
| Heffner Randy E | -- | None Available | |
| Heffner Randy E | -- | Lsi | |
| Heffner Randy E | $181,800 | -- |
Source: Public Records
Mortgage History
| Date | Status | Borrower | Loan Amount |
|---|---|---|---|
| Open | Heffner Randy E | $184,417 | |
| Closed | Heffner Randy E | $187,799 |
Source: Public Records
Tax History Compared to Growth
Tax History
| Year | Tax Paid | Tax Assessment Tax Assessment Total Assessment is a certain percentage of the fair market value that is determined by local assessors to be the total taxable value of land and additions on the property. | Land | Improvement |
|---|---|---|---|---|
| 2024 | $2,789 | $68,360 | $7,390 | $60,970 |
| 2023 | $2,789 | $68,360 | $7,390 | $60,970 |
| 2022 | $2,791 | $68,360 | $7,390 | $60,970 |
| 2021 | $2,402 | $56,180 | $7,420 | $48,760 |
| 2020 | $2,350 | $54,880 | $7,420 | $47,460 |
| 2019 | $2,349 | $54,880 | $7,420 | $47,460 |
| 2018 | $2,274 | $49,920 | $6,760 | $43,160 |
| 2017 | $2,399 | $49,920 | $6,760 | $43,160 |
| 2016 | $2,257 | $46,340 | $6,930 | $39,410 |
| 2015 | $2,257 | $46,340 | $6,930 | $39,410 |
| 2014 | $2,085 | $46,340 | $6,930 | $39,410 |
Source: Public Records
Map
Nearby Homes
- 306 Imperial Dr
- 0 Kingsridge Rd
- 3194 Forest Hills Dr
- 140 Huntington Ct
- 3186 Forest Hills Dr
- 138 Huntington Ct
- 3178 Forest Hills Dr
- 3170 Hampton Ct
- 3164 Forest Hills Dr
- 3177 Forest Hills Dr
- 3173 Forest Hills Dr
- 147 Huntington Ct
- 3158 Forest Hills Dr
- 139 Huntington Ct
- 3124 Gilson Ave
- 3165 Forest Hills Dr
- 3105 Forest Hills Dr
- 141 Huntington Ct
- 316 Carolina Ave
- 3150 Forest Hills Dr
- 335 Imperial Dr
- 305 Imperial Dr
- 326 Windsor Dr
- 316 Imperial Dr
- 355 Imperial Dr
- 352 Windsor Dr
- 326 Imperial Dr
- 306 Windsor Dr
- 300 Imperial Dr
- 356 Windsor Dr
- 356 Imperial Dr
- 421 Imperial Dr Unit RESB
- 429 Imperial Dr
- 376 Imperial Dr
- 265 Windsor Dr
- 295 Windsor Dr
- 396 Imperial Dr
- 420 Imperial Dr
- 400 Hill Blvd
- 3119 Kingsridge Ct