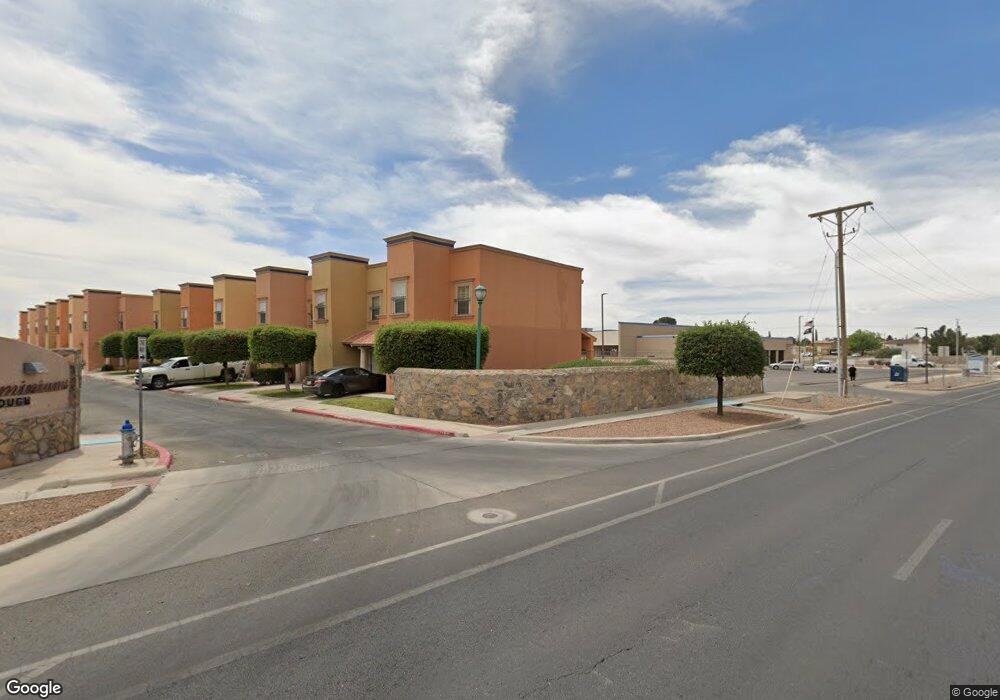
3150 N Yarbrough Dr Unit E1 El Paso, TX 79925
Pebble Hills NeighborhoodEstimated Value: $170,000 - $184,000
3
Beds
3
Baths
1,412
Sq Ft
$126/Sq Ft
Est. Value
About This Home
This home is located at 3150 N Yarbrough Dr Unit E1, El Paso, TX 79925 and is currently estimated at $178,406, approximately $126 per square foot. 3150 N Yarbrough Dr Unit E1 is a home located in El Paso County with nearby schools including Robbin E L Washington Elementary School, J M Hanks High School, and Jesus Chapel School.
Ownership History
Date
Name
Owned For
Owner Type
Purchase Details
Closed on
Jul 24, 2017
Sold by
The Secretary Of Veterans Affairs
Bought by
Castro Guillermo Lopez and Castro Angeles Lilia Tajonar
Current Estimated Value
Purchase Details
Closed on
May 22, 2012
Sold by
Christie Robert J
Bought by
Freedom Mortgage Corp
Home Financials for this Owner
Home Financials are based on the most recent Mortgage that was taken out on this home.
Original Mortgage
$146,682
Interest Rate
2.5%
Mortgage Type
VA
Purchase Details
Closed on
Dec 14, 2009
Sold by
Ept Pueblo Condominiums Lp
Bought by
Christie J Robert and Parker Molly
Home Financials for this Owner
Home Financials are based on the most recent Mortgage that was taken out on this home.
Original Mortgage
$141,988
Interest Rate
5.01%
Mortgage Type
VA
Create a Home Valuation Report for This Property
The Home Valuation Report is an in-depth analysis detailing your home's value as well as a comparison with similar homes in the area
Home Values in the Area
Average Home Value in this Area
Purchase History
| Date | Buyer | Sale Price | Title Company |
|---|---|---|---|
| Castro Guillermo Lopez | $77,000 | None Available | |
| Freedom Mortgage Corp | $79,007 | None Available | |
| Christie J Robert | -- | National Title Network Inc | |
| Christie J Robert | -- | Ct |
Source: Public Records
Mortgage History
| Date | Status | Borrower | Loan Amount |
|---|---|---|---|
| Previous Owner | Christie J Robert | $146,682 | |
| Previous Owner | Christie J Robert | $141,988 |
Source: Public Records
Tax History Compared to Growth
Tax History
| Year | Tax Paid | Tax Assessment Tax Assessment Total Assessment is a certain percentage of the fair market value that is determined by local assessors to be the total taxable value of land and additions on the property. | Land | Improvement |
|---|---|---|---|---|
| 2025 | $1,552 | $147,499 | -- | -- |
| 2024 | $1,552 | $134,090 | -- | -- |
| 2023 | $1,471 | $121,900 | $0 | $0 |
| 2022 | $3,441 | $110,818 | $8,499 | $102,319 |
| 2021 | $3,530 | $108,590 | $8,499 | $100,091 |
| 2020 | $3,430 | $108,590 | $8,499 | $100,091 |
| 2018 | $3,377 | $108,590 | $8,499 | $100,091 |
| 2017 | $4,217 | $137,966 | $8,499 | $129,467 |
| 2016 | $4,217 | $137,966 | $8,499 | $129,467 |
| 2015 | $3,948 | $137,966 | $8,499 | $129,467 |
| 2014 | $3,948 | $137,966 | $8,499 | $129,467 |
Source: Public Records
Map
Nearby Homes
- 3101 Vogue Dr
- 3112 Eads Place
- 2912 Chaswood St
- 10605 Kinross Ave Unit B
- 3213 Isla Cocoa Ln
- 10304 Blackwood Ave
- 2801 Brady Place
- 10301 Bayo Ave
- 10649 Islerock Dr
- 2701 Brady Place
- 3000 Woodall St
- 3317 Dungarvan Dr
- 10602 Drillstone Dr
- 3300 Tyrone Rd
- 10512 Album Ave
- 3400 Brookrock St
- 3332 Dungarvan Dr
- 10712 Gay Brewer Dr
- 3318 Limerick Rd
- 3369 Freeport Dr
- 3150 N Yarbrough Dr
- 3150 N Yarbrough Dr Unit E-5
- 3150 N Yarbrough Dr Unit E1
- 3150 N Yarbrough Dr Unit E1
- 3150 N Yarbrough Dr Unit E1
- 3150 N Yarbrough Dr Unit E
- 3150 N Yarbrough Dr Unit E
- 3150 N Yarbrough Dr Unit E
- 3150 N Yarbrough Dr Unit E
- 3150 N Yarbrough Dr Unit E
- 3150 N Yarbrough Dr Unit E
- 3150 N Yarbrough Dr Unit E
- 3150 N Yarbrough Dr Unit E
- 3150 N Yarbrough Dr Unit E
- 3150 N Yarbrough Dr Unit D
- 3150 N Yarbrough Dr Unit D
- 3150 N Yarbrough Dr Unit D
- 3150 N Yarbrough Dr Unit D
- 3150 N Yarbrough Dr Unit D
- 3150 N Yarbrough Dr Unit D