Estimated Value: $373,000 - $477,000
4
Beds
4
Baths
2,392
Sq Ft
$176/Sq Ft
Est. Value
About This Home
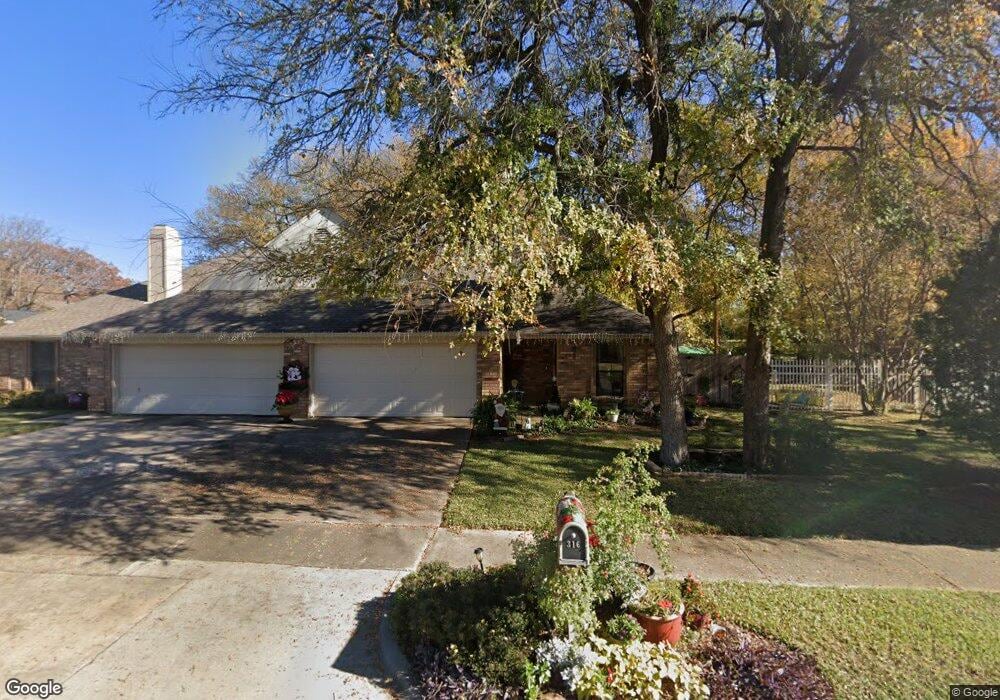
This home is located at 316 Moore Creek Rd, Hurst, TX 76053 and is currently estimated at $420,118, approximately $175 per square foot. 316 Moore Creek Rd is a home located in Tarrant County with nearby schools including Hurst Hills Elementary School, Hurst J High School, and L.D. Bell High School.
Ownership History
Date
Name
Owned For
Owner Type
Purchase Details
Closed on
Feb 14, 2008
Sold by
Rawls Aubrey R and Rawls Jodie
Bought by
Arawls Family Lp
Current Estimated Value
Purchase Details
Closed on
Mar 1, 2004
Sold by
M Carroll Family #1 Lp
Bought by
Rawls Aubrey R and Rawls Jodie
Home Financials for this Owner
Home Financials are based on the most recent Mortgage that was taken out on this home.
Original Mortgage
$137,600
Interest Rate
5.65%
Mortgage Type
Purchase Money Mortgage
Purchase Details
Closed on
Jul 1, 2002
Sold by
Carroll Miriam
Bought by
M Carroll Family #1 Lp
Purchase Details
Closed on
Jun 3, 1998
Sold by
Hopper Johnny Mack
Bought by
Carroll Miriam
Home Financials for this Owner
Home Financials are based on the most recent Mortgage that was taken out on this home.
Original Mortgage
$100,900
Interest Rate
6.91%
Mortgage Type
Purchase Money Mortgage
Create a Home Valuation Report for This Property
The Home Valuation Report is an in-depth analysis detailing your home's value as well as a comparison with similar homes in the area
Home Values in the Area
Average Home Value in this Area
Purchase History
| Date | Buyer | Sale Price | Title Company |
|---|---|---|---|
| Arawls Family Lp | -- | None Available | |
| Rawls Aubrey R | -- | Chicago Title Insurance Comp | |
| M Carroll Family #1 Lp | -- | Chicago Title Insurance Comp | |
| Carroll Miriam | -- | Alamo Title Co |
Source: Public Records
Mortgage History
| Date | Status | Borrower | Loan Amount |
|---|---|---|---|
| Previous Owner | Rawls Aubrey R | $137,600 | |
| Previous Owner | Carroll Miriam | $100,900 |
Source: Public Records
Tax History Compared to Growth
Tax History
| Year | Tax Paid | Tax Assessment Tax Assessment Total Assessment is a certain percentage of the fair market value that is determined by local assessors to be the total taxable value of land and additions on the property. | Land | Improvement |
|---|---|---|---|---|
| 2025 | $6,995 | $342,487 | $62,312 | $280,175 |
| 2024 | $6,995 | $342,487 | $62,312 | $280,175 |
| 2023 | $6,698 | $334,320 | $51,850 | $282,470 |
| 2022 | $5,930 | $257,541 | $40,000 | $217,541 |
| 2021 | $5,918 | $245,370 | $40,000 | $205,370 |
| 2020 | $6,113 | $254,081 | $40,000 | $214,081 |
| 2019 | $6,816 | $278,496 | $40,000 | $238,496 |
| 2018 | $5,904 | $241,208 | $40,000 | $201,208 |
| 2017 | $6,226 | $246,052 | $40,000 | $206,052 |
| 2016 | $5,235 | $206,874 | $40,000 | $166,874 |
| 2015 | $4,151 | $158,300 | $40,000 | $118,300 |
| 2014 | $4,151 | $158,300 | $40,000 | $118,300 |
Source: Public Records
Map
Nearby Homes
- 808 Betty Ct
- 741 Ponderosa Dr
- 408 Simmons Dr
- 405 Billy Creek Cir
- 425 Ridgecrest Dr
- 637 Post Oak Dr
- 529 Livingston Dr
- 758 Briarwood Ln
- 744 Briarwood Ln
- 1112 Blakey Ct
- 616 Timberline Dr
- 606 Ridgeline Dr
- 612 Elm St
- 649 Timberline Dr
- 545 Hurstview Dr
- 708 Hurstview Dr
- 3012 Silent Creek Trail
- 636 W Cedar St
- 516 Hurstview Dr
- 8736 Trinity Vista Trail
- 324 Moore Creek Rd
- 312 Moore Creek Rd
- 321 Moore Creek Rd
- 317 Moore Creek Rd
- 817 Henson Dr
- 325 Moore Creek Rd
- 328 Moore Creek Rd
- 309 Moore Creek Rd
- 305 Moore Creek Rd
- 300 Moore Creek Rd
- 300 Moore Creek Rd Unit 304
- 813 Henson Dr
- 814 Cullum Ct
- 329 Moore Creek Rd
- 320 Carnation Ln
- 812 Cullum Ct Unit 812
- 812 Cullum Ct
- 322 Carnation Ln
- 812 Cullum Ct
- 301 Moore Creek Rd