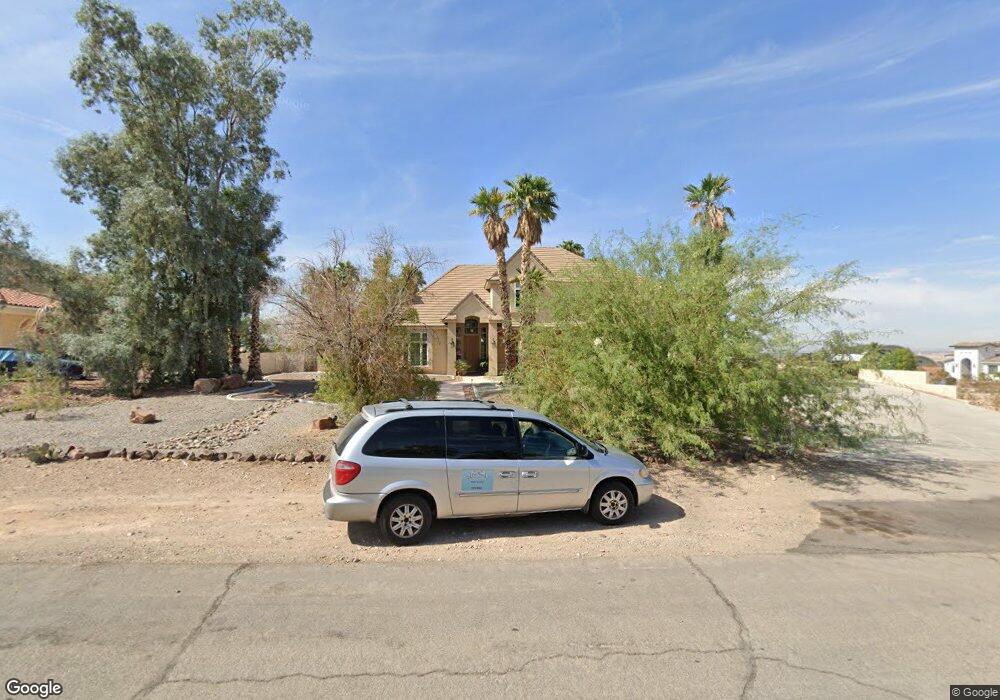
316 N Milan St Henderson, NV 89015
Foothills NeighborhoodEstimated Value: $916,307 - $1,009,000
5
Beds
4
Baths
3,160
Sq Ft
$311/Sq Ft
Est. Value
About This Home
This home is located at 316 N Milan St, Henderson, NV 89015 and is currently estimated at $983,077, approximately $311 per square foot. 316 N Milan St is a home located in Clark County with nearby schools including C T Sewell Elementary School, B Mahlon Brown Academy of International Studies, and Basic Academy of International Studies.
Ownership History
Date
Name
Owned For
Owner Type
Purchase Details
Closed on
Aug 16, 2019
Sold by
Viau Sandra L and Viau Mark R
Bought by
Viau Mark R
Current Estimated Value
Home Financials for this Owner
Home Financials are based on the most recent Mortgage that was taken out on this home.
Original Mortgage
$413,200
Outstanding Balance
$361,887
Interest Rate
3.7%
Mortgage Type
VA
Estimated Equity
$621,190
Purchase Details
Closed on
Mar 31, 1998
Sold by
Viau Sandra L and Viau Mark R
Bought by
Viau Mark R and Viau Sandra L
Home Financials for this Owner
Home Financials are based on the most recent Mortgage that was taken out on this home.
Original Mortgage
$262,600
Interest Rate
7%
Purchase Details
Closed on
Jan 14, 1997
Sold by
Bounds William B and Bounds Julia
Bought by
Viau Mark and Viau Sandi
Home Financials for this Owner
Home Financials are based on the most recent Mortgage that was taken out on this home.
Original Mortgage
$37,500
Interest Rate
7.46%
Mortgage Type
Seller Take Back
Create a Home Valuation Report for This Property
The Home Valuation Report is an in-depth analysis detailing your home's value as well as a comparison with similar homes in the area
Home Values in the Area
Average Home Value in this Area
Purchase History
| Date | Buyer | Sale Price | Title Company |
|---|---|---|---|
| Viau Mark R | -- | First American Title | |
| Viau Mark R | -- | Lawyers Title | |
| Viau Mark | $52,500 | First American Title Co |
Source: Public Records
Mortgage History
| Date | Status | Borrower | Loan Amount |
|---|---|---|---|
| Open | Viau Mark R | $413,200 | |
| Closed | Viau Mark R | $262,600 | |
| Closed | Viau Mark | $37,500 |
Source: Public Records
Tax History Compared to Growth
Tax History
| Year | Tax Paid | Tax Assessment Tax Assessment Total Assessment is a certain percentage of the fair market value that is determined by local assessors to be the total taxable value of land and additions on the property. | Land | Improvement |
|---|---|---|---|---|
| 2025 | $3,666 | $202,523 | $63,000 | $139,523 |
| 2024 | $3,560 | $202,523 | $63,000 | $139,523 |
| 2023 | $2,905 | $187,298 | $56,000 | $131,298 |
| 2022 | $3,456 | $169,350 | $49,000 | $120,350 |
| 2021 | $3,356 | $160,129 | $45,500 | $114,629 |
| 2020 | $3,255 | $160,971 | $47,250 | $113,721 |
| 2019 | $3,160 | $152,662 | $40,250 | $112,412 |
| 2018 | $3,104 | $134,297 | $26,250 | $108,047 |
| 2017 | $3,889 | $134,148 | $24,500 | $109,648 |
| 2016 | $2,905 | $125,097 | $24,500 | $100,597 |
| 2015 | $2,900 | $108,599 | $17,500 | $91,099 |
| 2014 | $2,815 | $94,278 | $17,500 | $76,778 |
Source: Public Records
Map
Nearby Homes
- 0 Lisbon St Unit 2682026
- 259 N Milan St
- 0 Milan St
- 441 Milan St
- 0 Parawan
- 132 N Lisbon St
- 408 N Lisbon St
- 428 N Lisbon St
- 0 N Magic Way
- 415 Emden St
- 831 Purple Sage Terrace
- 136 N Lisbon St
- 0 Cannes St
- 308 Belfast St
- 304 Belfast St
- 944 River Mountain Dr
- 263 Prairie Rose St
- 504 Emden St
- 0 Firth Ave
- 233 Mariposa Way
- 0 179-09-603-001
- 312 N Milan St
- 315 N Milan St
- 308 N Milan St
- 319 N Milan St
- 1030 London Ave
- 311 N Milan St
- 307 N Milan St
- 1030 Madrid Ave
- N Lisbon St
- 0 Lisbon St Unit 1416507
- 0 Lisbon St Unit 1438329
- 0 Lisbon St Unit 2351113
- 0 Lisbon St Unit 2405222
- 0 Lisbon St
- 329 N Lisbon St
- 0 Naples St
- 304 N Naples St
- 328 Lisbon St