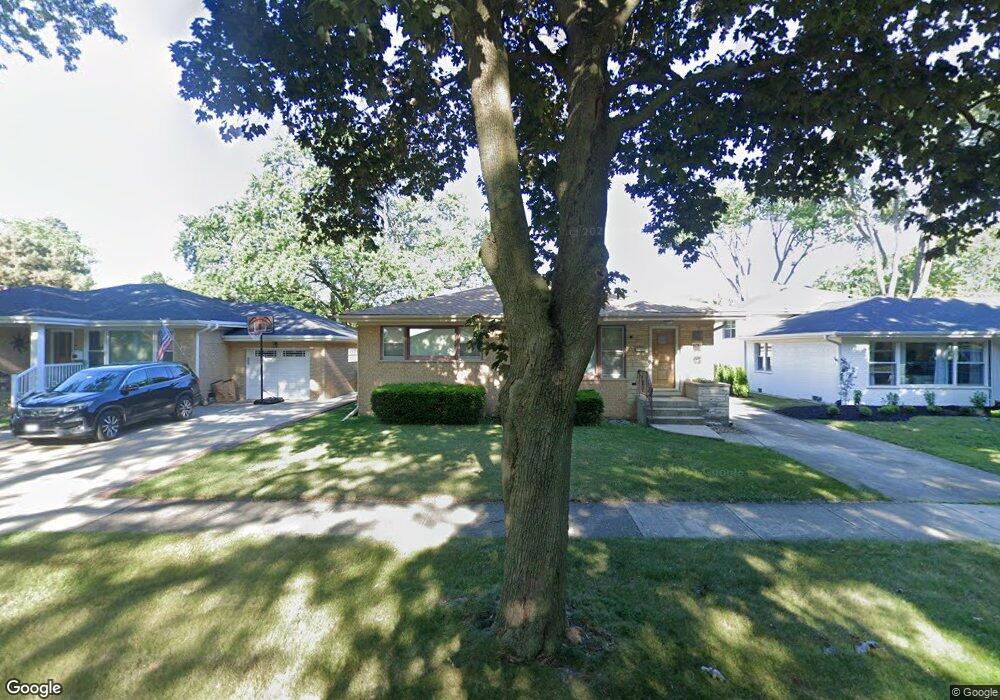
316 N Patton Ave Arlington Heights, IL 60005
Estimated Value: $408,677 - $431,000
3
Beds
1
Bath
1,184
Sq Ft
$353/Sq Ft
Est. Value
About This Home
This home is located at 316 N Patton Ave, Arlington Heights, IL 60005 and is currently estimated at $418,169, approximately $353 per square foot. 316 N Patton Ave is a home located in Cook County with nearby schools including Westgate Elementary School, South Middle School, and Rolling Meadows High School.
Ownership History
Date
Name
Owned For
Owner Type
Purchase Details
Closed on
Jul 29, 2014
Sold by
Harrigan Michael
Bought by
Declarat Harrigan Michael and Michael Harrigan 2014 Declaration Of Tru
Current Estimated Value
Create a Home Valuation Report for This Property
The Home Valuation Report is an in-depth analysis detailing your home's value as well as a comparison with similar homes in the area
Home Values in the Area
Average Home Value in this Area
Purchase History
| Date | Buyer | Sale Price | Title Company |
|---|---|---|---|
| Declarat Harrigan Michael | -- | None Available |
Source: Public Records
Tax History Compared to Growth
Tax History
| Year | Tax Paid | Tax Assessment Tax Assessment Total Assessment is a certain percentage of the fair market value that is determined by local assessors to be the total taxable value of land and additions on the property. | Land | Improvement |
|---|---|---|---|---|
| 2024 | $6,851 | $26,566 | $6,450 | $20,116 |
| 2023 | $6,571 | $28,342 | $6,450 | $21,892 |
| 2022 | $6,571 | $28,342 | $6,450 | $21,892 |
| 2021 | $7,039 | $26,715 | $4,031 | $22,684 |
| 2020 | $6,924 | $26,715 | $4,031 | $22,684 |
| 2019 | $6,893 | $29,684 | $4,031 | $25,653 |
| 2018 | $6,533 | $25,824 | $3,547 | $22,277 |
| 2017 | $6,474 | $25,824 | $3,547 | $22,277 |
| 2016 | $6,274 | $25,824 | $3,547 | $22,277 |
| 2015 | $5,706 | $21,947 | $3,063 | $18,884 |
| 2014 | $5,555 | $21,947 | $3,063 | $18,884 |
| 2013 | $5,680 | $22,954 | $3,063 | $19,891 |
Source: Public Records
Map
Nearby Homes
- 1418 W Saint James Place
- 1419 W Miner St
- 12 S Princeton Ct
- 24 S Kaspar Ave
- 34 N Reuter Dr
- 1615 W Johanna Terrace
- 514 W Miner St Unit 2F
- 617 N Wilke Rd
- 222 S Dwyer Ave
- 318 W Wing St
- 314 W Wing St
- 105 S Mitchell Ave
- 151 W Wing St Unit 301
- 827 N Walnut Ave
- 1 S Highland Ave Unit 800
- 1 S Highland Ave Unit 400
- 316 S Reuter Dr
- 201 N Vail Ave Unit 305
- 2201 Wren Ln
- 910 N Chestnut Ave
- 312 N Patton Ave
- 320 N Patton Ave
- 308 N Patton Ave
- 1105 W Saint James St
- 315 N Dwyer Ave
- 311 N Dwyer Ave
- 313 N Dwyer Ave
- 304 N Patton Ave
- 1115 W Saint James St
- 303 N Dwyer Ave
- 315 N Patton Ave
- 311 N Patton Ave
- 319 N Patton Ave
- 307 N Patton Ave
- 220 N Patton Ave
- 1015 W Saint James St
- 301 N Dwyer Ave
- 223 N Patton Ave
- 214 N Patton Ave
- 404 N Patton Ave