Estimated Value: $216,293 - $245,000
3
Beds
1
Bath
1,066
Sq Ft
$213/Sq Ft
Est. Value
About This Home
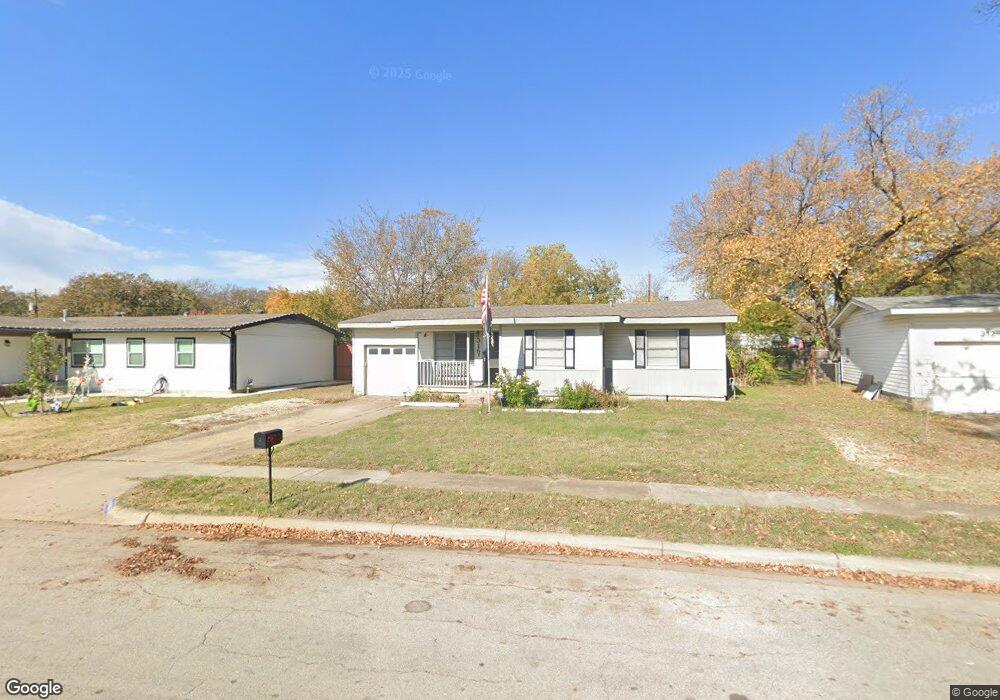
This home is located at 316 W Pecan St, Hurst, TX 76053 and is currently estimated at $226,573, approximately $212 per square foot. 316 W Pecan St is a home located in Tarrant County with nearby schools including Harrison Lane Elementary School, Hurst J High School, and L.D. Bell High School.
Ownership History
Date
Name
Owned For
Owner Type
Purchase Details
Closed on
Jul 10, 2019
Sold by
Quest Trust Company
Bought by
Sosa Jason
Current Estimated Value
Home Financials for this Owner
Home Financials are based on the most recent Mortgage that was taken out on this home.
Original Mortgage
$143,075
Outstanding Balance
$125,552
Interest Rate
3.9%
Mortgage Type
New Conventional
Estimated Equity
$101,021
Purchase Details
Closed on
Oct 2, 2017
Sold by
Heb Homes Llc
Bought by
Quest Ira Inc and Ferank Laux
Purchase Details
Closed on
Sep 9, 2017
Sold by
Cope Allen and Stanley Carol Frances
Bought by
Cope Allen
Purchase Details
Closed on
Sep 7, 2017
Sold by
Stanley Bobby
Bought by
Cope Allen
Purchase Details
Closed on
Apr 10, 2009
Sold by
Mathis Charles E and Mathis Jo Ann
Bought by
Stanley Carol F
Create a Home Valuation Report for This Property
The Home Valuation Report is an in-depth analysis detailing your home's value as well as a comparison with similar homes in the area
Home Values in the Area
Average Home Value in this Area
Purchase History
| Date | Buyer | Sale Price | Title Company |
|---|---|---|---|
| Sosa Jason | -- | Itc | |
| Quest Ira Inc | -- | None Available | |
| Heb Homes Llc | -- | None Available | |
| Cope Allen | -- | None Available | |
| Cope Allen | -- | None Available | |
| Stanley Carol F | -- | None Available |
Source: Public Records
Mortgage History
| Date | Status | Borrower | Loan Amount |
|---|---|---|---|
| Open | Sosa Jason | $143,075 |
Source: Public Records
Tax History Compared to Growth
Tax History
| Year | Tax Paid | Tax Assessment Tax Assessment Total Assessment is a certain percentage of the fair market value that is determined by local assessors to be the total taxable value of land and additions on the property. | Land | Improvement |
|---|---|---|---|---|
| 2025 | $2,566 | $210,111 | $50,000 | $160,111 |
| 2024 | $2,566 | $210,111 | $50,000 | $160,111 |
| 2023 | $3,837 | $191,540 | $30,000 | $161,540 |
| 2022 | $4,134 | $179,540 | $30,000 | $149,540 |
| 2021 | $3,515 | $145,731 | $30,000 | $115,731 |
| 2020 | $3,177 | $132,048 | $30,000 | $102,048 |
| 2019 | $2,849 | $116,422 | $30,000 | $86,422 |
| 2018 | $2,468 | $100,839 | $19,000 | $81,839 |
| 2017 | $2,009 | $112,267 | $19,000 | $93,267 |
| 2016 | $1,826 | $94,947 | $19,000 | $75,947 |
| 2015 | $1,366 | $65,600 | $13,500 | $52,100 |
| 2014 | $1,366 | $65,600 | $13,500 | $52,100 |
Source: Public Records
Map
Nearby Homes
- 231 Elm St
- 516 Hurstview Dr
- 624 Harrison Ln
- 552 Norwood Dr
- 708 Hurstview Dr
- 520 W Redbud Dr
- 612 Elm St
- 127 W Cedar St
- 644 Caduceus Ln
- 628 Elm St
- 508 Oak Park Dr
- 744 Briarwood Ln
- 425 Ridgecrest Dr
- 120 Charlene Dr
- 1016 Keith Dr
- 205 Corinna Ct
- 408 Simmons Dr
- 120 Donald Dr
- 758 Briarwood Ln
- 125 Souder Dr