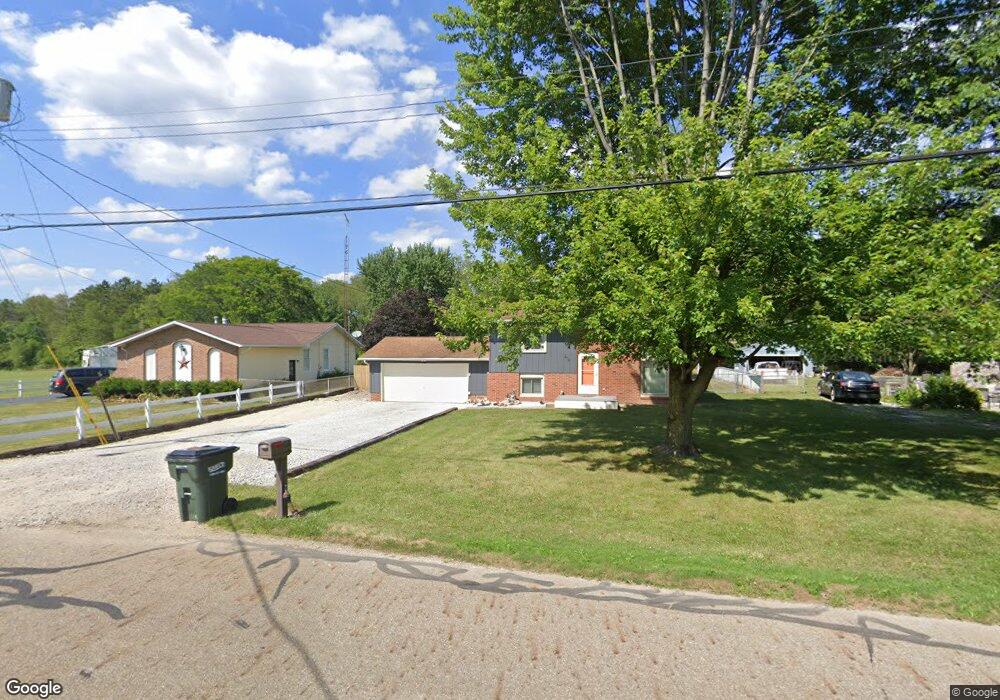
319 Taff Cir Louisville, OH 44641
Estimated Value: $176,000 - $211,679
3
Beds
2
Baths
1,344
Sq Ft
$139/Sq Ft
Est. Value
About This Home
This home is located at 319 Taff Cir, Louisville, OH 44641 and is currently estimated at $186,920, approximately $139 per square foot. 319 Taff Cir is a home located in Stark County with nearby schools including Louisville High School and St. Thomas Aquinas High School & Middle School.
Ownership History
Date
Name
Owned For
Owner Type
Purchase Details
Closed on
Jun 30, 2021
Sold by
Texter Jason D
Bought by
Texter Jason D
Current Estimated Value
Purchase Details
Closed on
Jan 17, 2011
Sold by
Mills Paul A and Mills Pamela J
Bought by
Texter Jason D
Home Financials for this Owner
Home Financials are based on the most recent Mortgage that was taken out on this home.
Original Mortgage
$79,177
Outstanding Balance
$53,331
Interest Rate
4.53%
Mortgage Type
New Conventional
Estimated Equity
$133,589
Purchase Details
Closed on
Jul 13, 1994
Sold by
Richard Lester A
Bought by
Mills Paul A and Mills Pamela
Home Financials for this Owner
Home Financials are based on the most recent Mortgage that was taken out on this home.
Original Mortgage
$59,000
Interest Rate
8.6%
Mortgage Type
New Conventional
Purchase Details
Closed on
Jul 15, 1991
Create a Home Valuation Report for This Property
The Home Valuation Report is an in-depth analysis detailing your home's value as well as a comparison with similar homes in the area
Home Values in the Area
Average Home Value in this Area
Purchase History
| Date | Buyer | Sale Price | Title Company |
|---|---|---|---|
| Texter Jason D | -- | None Available | |
| Texter Jason D | $76,500 | Cornerstone Real Estate Titl | |
| Mills Paul A | $71,000 | -- | |
| -- | $59,900 | -- |
Source: Public Records
Mortgage History
| Date | Status | Borrower | Loan Amount |
|---|---|---|---|
| Open | Texter Jason D | $79,177 | |
| Previous Owner | Mills Paul A | $59,000 |
Source: Public Records
Tax History Compared to Growth
Tax History
| Year | Tax Paid | Tax Assessment Tax Assessment Total Assessment is a certain percentage of the fair market value that is determined by local assessors to be the total taxable value of land and additions on the property. | Land | Improvement |
|---|---|---|---|---|
| 2025 | -- | $54,570 | $18,760 | $35,810 |
| 2024 | -- | $54,570 | $18,760 | $35,810 |
| 2023 | $2,084 | $48,480 | $18,590 | $29,890 |
| 2022 | $2,089 | $48,480 | $18,590 | $29,890 |
| 2021 | $2,095 | $48,480 | $18,590 | $29,890 |
| 2020 | $1,743 | $43,790 | $16,770 | $27,020 |
| 2019 | $1,750 | $43,790 | $16,770 | $27,020 |
| 2018 | $1,743 | $43,790 | $16,770 | $27,020 |
| 2017 | $1,552 | $37,600 | $13,690 | $23,910 |
| 2016 | $1,583 | $37,600 | $13,690 | $23,910 |
| 2015 | $1,588 | $37,600 | $13,690 | $23,910 |
| 2014 | $1,473 | $32,420 | $11,800 | $20,620 |
| 2013 | $740 | $32,420 | $11,800 | $20,620 |
Source: Public Records
Map
Nearby Homes
- 1702 View Pointe Ave
- 908 Sand Lot Cir
- 1639 Horizon Dr
- 510 S Bauman Ct
- 204 E Broad St
- 728 E Broad St
- 520 S Silver St
- 107 E Broad St
- 641 S Nickelplate St
- 308 Superior St
- 1715 High St
- 325 Lincoln Ave
- 1812 E Broad St
- 8225 Georgetown St
- 2110 Edmar St
- 0 Michigan Blvd
- 201 Indiana Ave
- 3390 Meese Rd NE
- 6969 Georgetown St NE
- 248 Menegay Rd
- 403 Taff Cir
- 311 Taff Cir
- 411 Taff Cir
- 312 Taff Cir
- 408 Taff Cir
- 417 Taff Cir
- 302 1123
- 302 Taff Cir
- 302 Taff Cir Unit C
- 216 Taff Cir
- 216 Taff Cir Unit C
- 216 Taff Cir Unit A
- 216 Taff Cir Unit B
- 505 Taff Cir
- 210 Taff Cir
- 210 Taff Cir Unit B
- 210 Taff Cir Unit A
- 210 Taff Cir Unit C
- 511 Taff Cir
- 519 Taff Cir