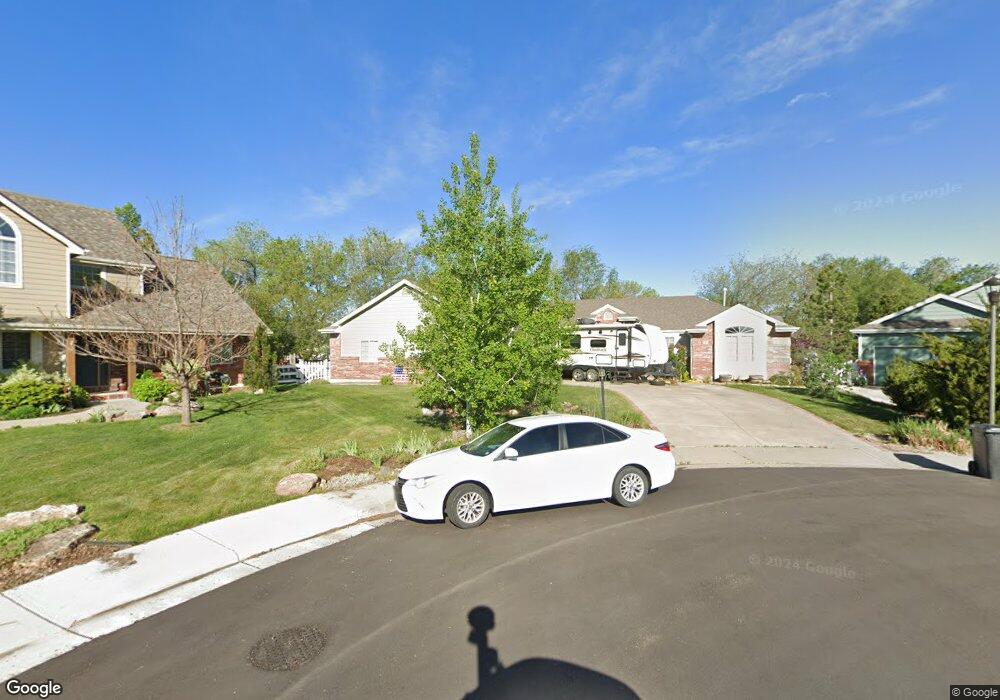
3194 6th Place SW Loveland, CO 80537
Estimated Value: $607,241 - $808,000
3
Beds
2
Baths
1,950
Sq Ft
$347/Sq Ft
Est. Value
About This Home
This home is located at 3194 6th Place SW, Loveland, CO 80537 and is currently estimated at $676,060, approximately $346 per square foot. 3194 6th Place SW is a home located in Larimer County with nearby schools including Namaqua Elementary School, Walt Clark Middle School, and Thompson Valley High School.
Ownership History
Date
Name
Owned For
Owner Type
Purchase Details
Closed on
Aug 29, 2003
Sold by
Riley Cristin C
Bought by
Riley Cristin C and Riley Michael
Current Estimated Value
Home Financials for this Owner
Home Financials are based on the most recent Mortgage that was taken out on this home.
Original Mortgage
$279,000
Outstanding Balance
$128,181
Interest Rate
6.1%
Mortgage Type
Purchase Money Mortgage
Estimated Equity
$547,879
Purchase Details
Closed on
Aug 27, 1998
Sold by
Rust Construction Inc
Bought by
Riley Cristin C
Home Financials for this Owner
Home Financials are based on the most recent Mortgage that was taken out on this home.
Original Mortgage
$186,100
Interest Rate
6.94%
Purchase Details
Closed on
Mar 30, 1998
Sold by
Bray Enterprises Inc
Bought by
Rust Construction Inc
Home Financials for this Owner
Home Financials are based on the most recent Mortgage that was taken out on this home.
Original Mortgage
$166,100
Interest Rate
7.17%
Mortgage Type
Construction
Create a Home Valuation Report for This Property
The Home Valuation Report is an in-depth analysis detailing your home's value as well as a comparison with similar homes in the area
Home Values in the Area
Average Home Value in this Area
Purchase History
| Date | Buyer | Sale Price | Title Company |
|---|---|---|---|
| Riley Cristin C | -- | -- | |
| Riley Cristin C | $248,156 | -- | |
| Rust Construction Inc | $38,000 | -- |
Source: Public Records
Mortgage History
| Date | Status | Borrower | Loan Amount |
|---|---|---|---|
| Open | Riley Cristin C | $279,000 | |
| Closed | Riley Cristin C | $186,100 | |
| Previous Owner | Rust Construction Inc | $166,100 | |
| Closed | Riley Cristin C | $49,631 |
Source: Public Records
Tax History Compared to Growth
Tax History
| Year | Tax Paid | Tax Assessment Tax Assessment Total Assessment is a certain percentage of the fair market value that is determined by local assessors to be the total taxable value of land and additions on the property. | Land | Improvement |
|---|---|---|---|---|
| 2025 | $3,115 | $42,713 | $3,082 | $39,631 |
| 2024 | $3,004 | $42,713 | $3,082 | $39,631 |
| 2022 | $2,470 | $31,046 | $3,197 | $27,849 |
| 2021 | $2,538 | $31,939 | $3,289 | $28,650 |
| 2020 | $2,359 | $29,673 | $3,289 | $26,384 |
| 2019 | $2,319 | $29,673 | $3,289 | $26,384 |
| 2018 | $2,268 | $27,562 | $3,312 | $24,250 |
| 2017 | $1,953 | $27,562 | $3,312 | $24,250 |
| 2016 | $1,971 | $26,873 | $3,662 | $23,211 |
| 2015 | $1,955 | $26,870 | $3,660 | $23,210 |
| 2014 | $1,707 | $22,700 | $3,660 | $19,040 |
Source: Public Records
Map
Nearby Homes
- 428 Candelaria Dr
- 543 Dana Ct
- 450 Wapola Ave
- 1014 Prism Cactus Cir
- 3560 Peruvian Torch Dr
- 2821 5th St SW
- 3700 W 1st St
- 115 Anders Ct
- 1158 Blue Agave Ct
- 1168 Blue Agave Ct
- 138 Pamela Dr
- 1028 Cynthia Ct
- 219 Medina Ct
- 2828 Mango Place
- 204 Shupe Cir
- 827 S Buckeye Dr
- 1167 Cynthia Ct
- 2503 10th St SW
- 2583 Begonia Ct
- 874 S Buckeye Dr
- 3180 6th Place SW
- 3199 6th Place SW
- 3185 6th Place SW
- 3166 6th Place SW
- 3171 6th Place SW
- 3316 Canter Ln
- 3157 6th Place SW
- 3152 6th Place SW
- 543 Marcellina Dr
- 551 Marcellina Dr
- 3143 6th Place SW
- 3138 6th Place SW
- 559 Marcellina Dr
- 535 Marcellina Dr
- 604 Namaqua Rd
- 3129 6th Place SW
- 3302 Canter Ln
- 3204 Canter Ln
- 567 Marcellina Dr
- 710 Namaqua Rd