Estimated Value: $1,354,000 - $1,492,000
3
Beds
2
Baths
1,632
Sq Ft
$867/Sq Ft
Est. Value
About This Home
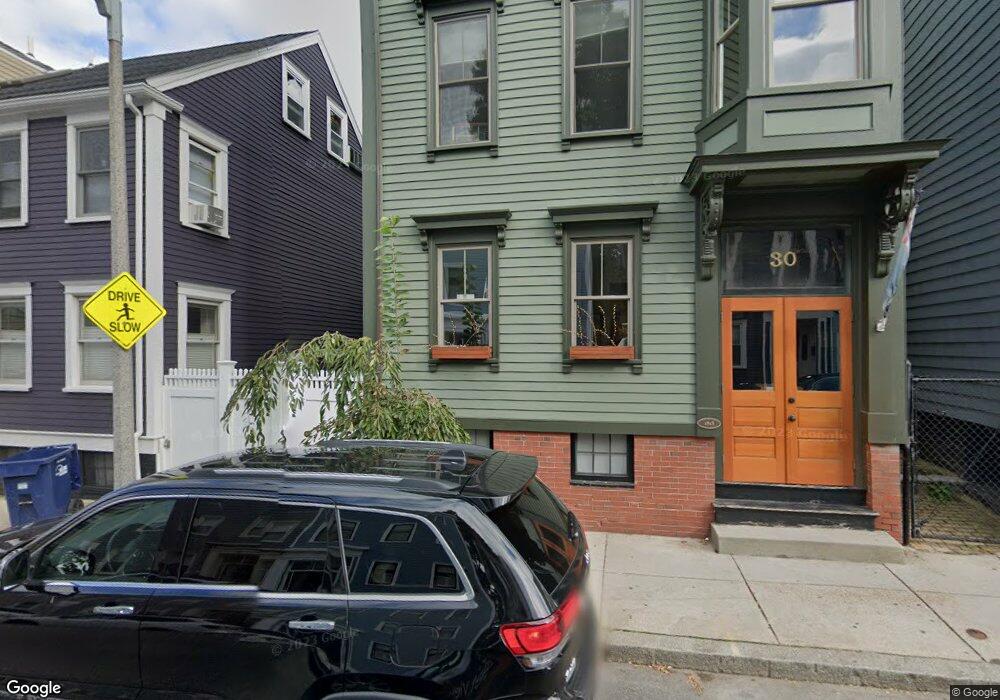
This home is located at 32 Green St, Charlestown, MA 02129 and is currently estimated at $1,415,584, approximately $867 per square foot. 32 Green St is a home located in Suffolk County with nearby schools including Boston Children's School and St John School.
Ownership History
Date
Name
Owned For
Owner Type
Purchase Details
Closed on
Aug 14, 2012
Sold by
Godding Joan R Est
Bought by
Rosenshein Mark J and Rosenshein Beth S
Current Estimated Value
Home Financials for this Owner
Home Financials are based on the most recent Mortgage that was taken out on this home.
Original Mortgage
$417,000
Outstanding Balance
$289,285
Interest Rate
3.7%
Mortgage Type
New Conventional
Estimated Equity
$1,126,299
Create a Home Valuation Report for This Property
The Home Valuation Report is an in-depth analysis detailing your home's value as well as a comparison with similar homes in the area
Home Values in the Area
Average Home Value in this Area
Purchase History
| Date | Buyer | Sale Price | Title Company |
|---|---|---|---|
| Rosenshein Mark J | $527,000 | -- |
Source: Public Records
Mortgage History
| Date | Status | Borrower | Loan Amount |
|---|---|---|---|
| Open | Rosenshein Mark J | $417,000 |
Source: Public Records
Tax History Compared to Growth
Tax History
| Year | Tax Paid | Tax Assessment Tax Assessment Total Assessment is a certain percentage of the fair market value that is determined by local assessors to be the total taxable value of land and additions on the property. | Land | Improvement |
|---|---|---|---|---|
| 2025 | $13,051 | $1,127,000 | $470,200 | $656,800 |
| 2024 | $11,666 | $1,070,300 | $441,900 | $628,400 |
| 2023 | $10,948 | $1,019,400 | $420,900 | $598,500 |
| 2022 | $10,082 | $926,700 | $382,600 | $544,100 |
| 2021 | $9,694 | $908,500 | $375,100 | $533,400 |
| 2020 | $9,442 | $894,100 | $364,600 | $529,500 |
| 2019 | $9,229 | $875,600 | $295,500 | $580,100 |
| 2018 | $8,660 | $826,300 | $295,500 | $530,800 |
| 2017 | $8,099 | $764,800 | $295,500 | $469,300 |
| 2016 | $7,756 | $705,100 | $295,500 | $409,600 |
| 2015 | $7,116 | $587,600 | $251,900 | $335,700 |
| 2014 | $6,457 | $513,300 | $252,600 | $260,700 |
Source: Public Records
Map
Nearby Homes
- 56 High St Unit 3
- 46 High St
- 172 Bunker Hill St Unit 1
- 207 Bunker Hill St Unit 2
- 9 Russell St Unit 2
- 9 Russell St Unit 1
- 247 Bunker Hill St Unit A
- 15 Russell St
- 5 Wallace Ct
- 106 Bunker Hill St Unit 2
- 106 Bunker Hill St Unit 6
- 106 Bunker Hill St Unit 1
- 106 Bunker Hill St Unit 4P
- 106 Bunker Hill St Unit 3
- 255 Bunker Hill St Unit 2
- 270 Bunker Hill St Unit 4
- 254-256 Medford St Unit 2
- 12 Prospect St Unit 2
- 12 Prospect St Unit 1
- 64 Walker St Unit 66