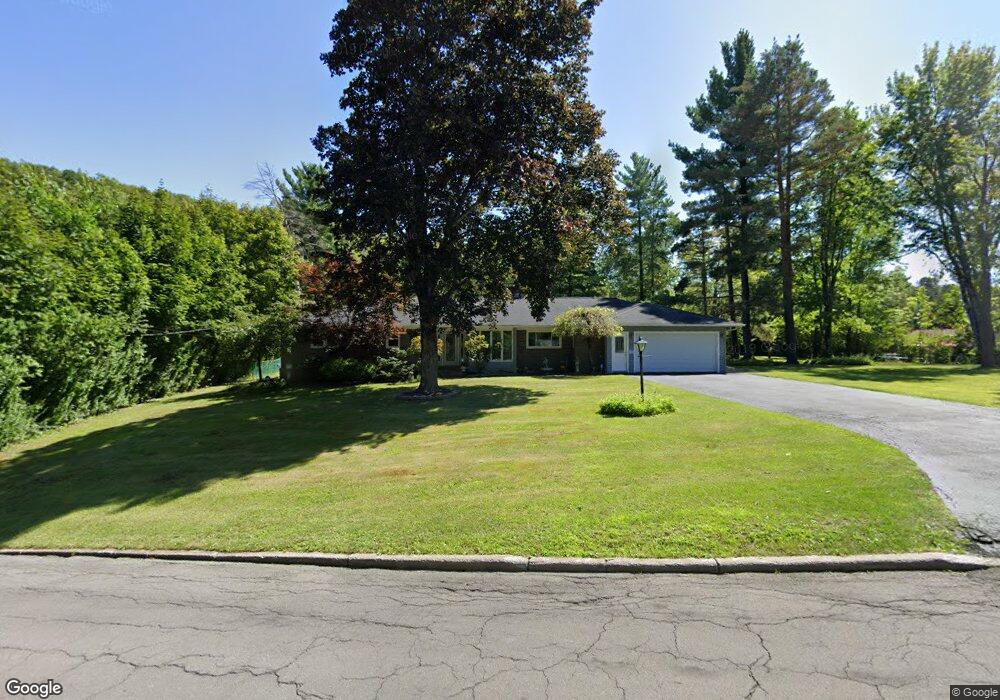
32 Pond Ln Utica, NY 13501
East Utica NeighborhoodEstimated Value: $320,000 - $384,239
3
Beds
3
Baths
1,898
Sq Ft
$181/Sq Ft
Est. Value
About This Home
This home is located at 32 Pond Ln, Utica, NY 13501 and is currently estimated at $344,310, approximately $181 per square foot. 32 Pond Ln is a home located in Oneida County with nearby schools including Thomas R. Proctor High School, Tradewinds Education Center, and Upstate Cerebral Palsy Inc.
Ownership History
Date
Name
Owned For
Owner Type
Purchase Details
Closed on
Jul 31, 2019
Sold by
Corelli Anthony
Bought by
Corelli Dominic A and Scharf Emily E
Current Estimated Value
Home Financials for this Owner
Home Financials are based on the most recent Mortgage that was taken out on this home.
Original Mortgage
$176,000
Outstanding Balance
$154,143
Interest Rate
3.7%
Mortgage Type
Adjustable Rate Mortgage/ARM
Estimated Equity
$190,167
Purchase Details
Closed on
Aug 6, 1998
Create a Home Valuation Report for This Property
The Home Valuation Report is an in-depth analysis detailing your home's value as well as a comparison with similar homes in the area
Home Values in the Area
Average Home Value in this Area
Purchase History
| Date | Buyer | Sale Price | Title Company |
|---|---|---|---|
| Corelli Dominic A | $220,000 | -- | |
| -- | -- | -- |
Source: Public Records
Mortgage History
| Date | Status | Borrower | Loan Amount |
|---|---|---|---|
| Open | Corelli Dominic A | $176,000 |
Source: Public Records
Tax History Compared to Growth
Tax History
| Year | Tax Paid | Tax Assessment Tax Assessment Total Assessment is a certain percentage of the fair market value that is determined by local assessors to be the total taxable value of land and additions on the property. | Land | Improvement |
|---|---|---|---|---|
| 2024 | $4,044 | $100,000 | $40,300 | $59,700 |
| 2023 | $2,682 | $100,000 | $40,300 | $59,700 |
| 2022 | $4,057 | $100,000 | $40,300 | $59,700 |
| 2021 | $4,035 | $100,000 | $40,300 | $59,700 |
| 2020 | $3,956 | $100,000 | $40,300 | $59,700 |
| 2019 | $2,189 | $100,000 | $40,300 | $59,700 |
| 2018 | $1,202 | $100,000 | $40,300 | $59,700 |
| 2017 | $3,881 | $100,000 | $40,300 | $59,700 |
| 2016 | $5,313 | $100,000 | $40,300 | $59,700 |
| 2015 | -- | $100,000 | $40,300 | $59,700 |
| 2014 | -- | $100,000 | $40,300 | $59,700 |
Source: Public Records
Map
Nearby Homes