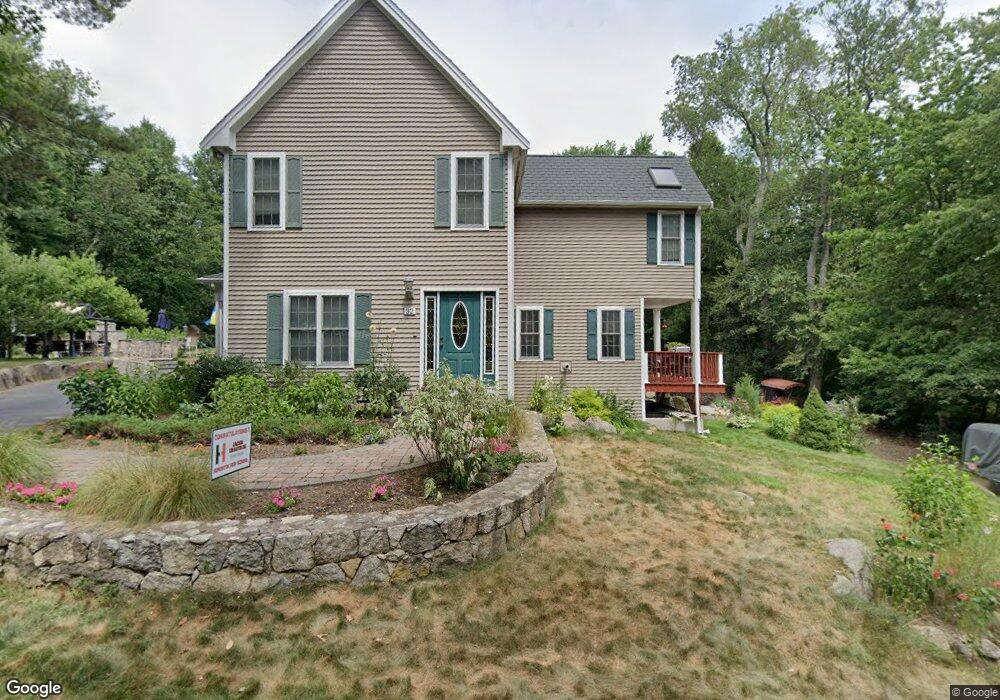
32 Proctor St Hopkinton, MA 01748
Estimated Value: $1,036,829 - $1,125,000
4
Beds
3
Baths
2,820
Sq Ft
$380/Sq Ft
Est. Value
About This Home
This home is located at 32 Proctor St, Hopkinton, MA 01748 and is currently estimated at $1,071,457, approximately $379 per square foot. 32 Proctor St is a home located in Middlesex County with nearby schools including Elmwood Elementary School, Hopkins Elementary School, and Hopkinton Middle School.
Ownership History
Date
Name
Owned For
Owner Type
Purchase Details
Closed on
Aug 27, 2009
Sold by
Mass Prop Solutions Ll
Bought by
Chastain Zachary and Chastain Iryna
Current Estimated Value
Home Financials for this Owner
Home Financials are based on the most recent Mortgage that was taken out on this home.
Original Mortgage
$508,850
Outstanding Balance
$332,448
Interest Rate
5.17%
Mortgage Type
VA
Estimated Equity
$739,009
Purchase Details
Closed on
Apr 22, 2008
Sold by
Fnma
Bought by
Mass Prop Solutions Ll
Purchase Details
Closed on
Mar 28, 2008
Sold by
Liasson Mark H and Liasson Carol Jo
Bought by
Federal National Mortgage Association
Create a Home Valuation Report for This Property
The Home Valuation Report is an in-depth analysis detailing your home's value as well as a comparison with similar homes in the area
Home Values in the Area
Average Home Value in this Area
Purchase History
| Date | Buyer | Sale Price | Title Company |
|---|---|---|---|
| Chastain Zachary | $540,000 | -- | |
| Mass Prop Solutions Ll | $230,000 | -- | |
| Federal National Mortgage Association | $239,143 | -- |
Source: Public Records
Mortgage History
| Date | Status | Borrower | Loan Amount |
|---|---|---|---|
| Open | Chastain Zachary | $508,850 |
Source: Public Records
Tax History Compared to Growth
Tax History
| Year | Tax Paid | Tax Assessment Tax Assessment Total Assessment is a certain percentage of the fair market value that is determined by local assessors to be the total taxable value of land and additions on the property. | Land | Improvement |
|---|---|---|---|---|
| 2025 | $12,354 | $871,200 | $307,200 | $564,000 |
| 2024 | $11,432 | $782,500 | $292,400 | $490,100 |
| 2023 | $11,206 | $708,800 | $256,700 | $452,100 |
| 2022 | $10,995 | $645,600 | $233,100 | $412,500 |
| 2021 | $10,637 | $622,800 | $226,200 | $396,600 |
| 2020 | $10,111 | $601,100 | $220,900 | $380,200 |
| 2019 | $10,147 | $591,000 | $216,600 | $374,400 |
| 2018 | $9,408 | $556,700 | $206,100 | $350,600 |
| 2017 | $9,070 | $539,900 | $200,000 | $339,900 |
| 2016 | $8,959 | $526,100 | $196,100 | $330,000 |
| 2015 | $8,881 | $494,500 | $190,500 | $304,000 |
Source: Public Records
Map
Nearby Homes