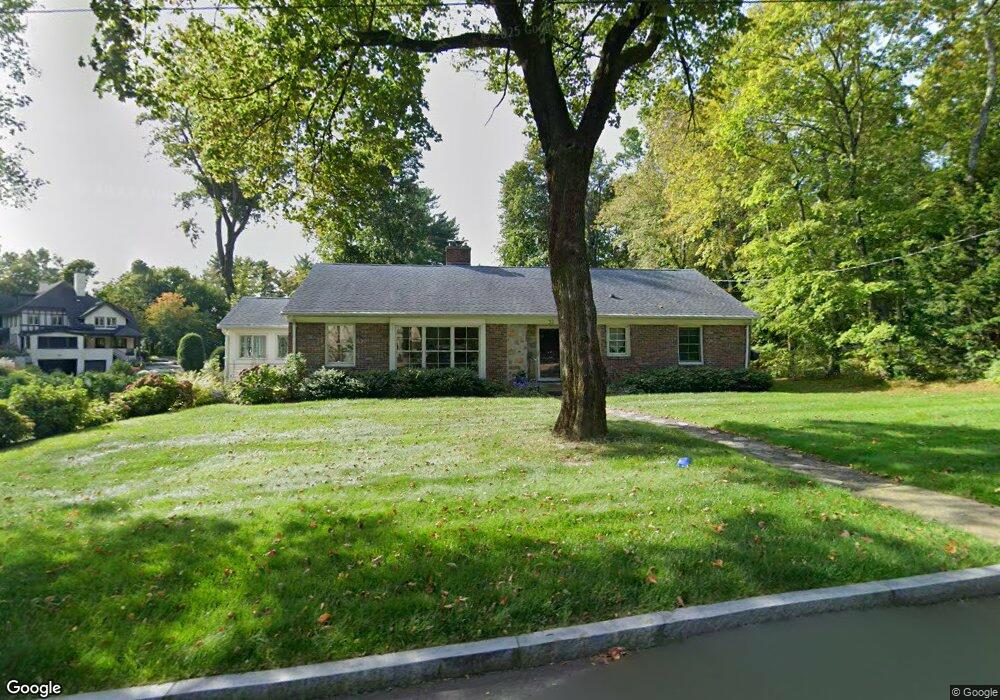
32 River Terrace Holyoke, MA 01040
Estimated Value: $386,000 - $491,000
4
Beds
2
Baths
1,638
Sq Ft
$266/Sq Ft
Est. Value
About This Home
This home is located at 32 River Terrace, Holyoke, MA 01040 and is currently estimated at $435,424, approximately $265 per square foot. 32 River Terrace is a home located in Hampden County with nearby schools including E.N. White Elementary School, Holyoke High School, and First Lutheran Christian School.
Ownership History
Date
Name
Owned For
Owner Type
Purchase Details
Closed on
Jul 29, 2005
Sold by
Morris Franklin A and Morris Marie E
Bought by
Tunstall Angelica M and Tunstall Timothy P
Current Estimated Value
Home Financials for this Owner
Home Financials are based on the most recent Mortgage that was taken out on this home.
Original Mortgage
$200,000
Interest Rate
5.67%
Mortgage Type
Purchase Money Mortgage
Purchase Details
Closed on
Jan 17, 2002
Sold by
Werenski Chestra A and Nadarzynski Sandra E
Bought by
Morris Franklin A and Morris Marie E
Home Financials for this Owner
Home Financials are based on the most recent Mortgage that was taken out on this home.
Original Mortgage
$112,500
Interest Rate
6.84%
Mortgage Type
Purchase Money Mortgage
Create a Home Valuation Report for This Property
The Home Valuation Report is an in-depth analysis detailing your home's value as well as a comparison with similar homes in the area
Home Values in the Area
Average Home Value in this Area
Purchase History
| Date | Buyer | Sale Price | Title Company |
|---|---|---|---|
| Tunstall Angelica M | $262,000 | -- | |
| Morris Franklin A | $125,000 | -- |
Source: Public Records
Mortgage History
| Date | Status | Borrower | Loan Amount |
|---|---|---|---|
| Open | Morris Franklin A | $160,000 | |
| Closed | Morris Franklin A | $181,600 | |
| Closed | Tunstall Angelica M | $200,000 | |
| Previous Owner | Morris Franklin A | $123,000 | |
| Previous Owner | Morris Franklin A | $112,500 |
Source: Public Records
Tax History Compared to Growth
Tax History
| Year | Tax Paid | Tax Assessment Tax Assessment Total Assessment is a certain percentage of the fair market value that is determined by local assessors to be the total taxable value of land and additions on the property. | Land | Improvement |
|---|---|---|---|---|
| 2025 | $5,675 | $325,000 | $81,800 | $243,200 |
| 2024 | $5,249 | $277,000 | $78,000 | $199,000 |
| 2023 | $5,033 | $268,300 | $78,000 | $190,300 |
| 2022 | $4,830 | $250,800 | $78,000 | $172,800 |
| 2021 | $4,220 | $219,000 | $78,000 | $141,000 |
| 2020 | $4,026 | $211,000 | $78,000 | $133,000 |
| 2019 | $3,899 | $202,100 | $78,000 | $124,100 |
| 2018 | $6,878 | $195,600 | $78,000 | $117,600 |
| 2017 | $3,750 | $195,600 | $78,000 | $117,600 |
| 2016 | $3,746 | $195,900 | $80,300 | $115,600 |
| 2015 | $3,730 | $195,900 | $80,300 | $115,600 |
Source: Public Records
Map
Nearby Homes
- 10 Radcliffe St
- 1212 Northampton St
- 1205 Northampton St
- 31 Wellesley Rd
- 22 Liberty St
- 17 Cleveland St
- 77 Central Park Dr
- 4 Claren Dr
- 119 Central Park Dr
- 211 Pleasant St
- 50 Nonotuck St
- 102 W Meadowview Rd
- 129 Morgan St
- 11 Longfellow Rd
- 121 W Meadowview Rd
- 68 Fairfield Ave
- 55 Longfellow Rd
- 165 Lincoln St
- 429 Pleasant St
- 1225 Hampden St
- 28 River Terrace
- 11 River Terrace
- 15 River Terrace
- 50 River Terrace
- 54 Montgomery Ave- Left Unit Unit 2
- 41 Hampton Knolls Rd
- 54 Montgomery Ave
- 54 Montgomery Ave Unit Left
- 54 Montgomery Ave Unit 2
- 33 Hampton Knolls Rd
- 17 River Terrace
- 24 River Terrace
- 50 Montgomery Ave
- 65 Montgomery Ave
- 20 Bullard Ave
- 47 Hampton Knolls Rd
- 47 Hampton Knolls Rd Unit 1
- 46 Montgomery Ave
- 40 River Terrace
- 47 Montgomery Ave